
Influence diagrams are essential tools in project management, providing a visual representation of the relationships among various project elements. They are especially useful in helping project managers identify the key factors that can impact a project’s success or failure. By modeling these influences, project managers can make more informed decisions and better allocate resources.
The PMP (Project Management Professional) certification is recognized globally as a validation of a project manager’s knowledge and skills. Understanding and effectively utilizing influence diagrams is an important part of the PMP exam and a crucial skill for any project manager.
Influence diagrams consist of nodes and arcs, with nodes representing the project variables and arcs representing the relationships between these variables. Variables can be positive or negative, and their relationships can be direct or indirect. By analyzing the influence diagram, project managers can identify the dependencies and interconnections among project variables.
With influence diagrams, project managers can also perform sensitivity analysis, which involves evaluating how changes in one variable can impact other variables. This helps project managers anticipate and plan for potential risks and challenges. Furthermore, influence diagrams can support decision-making processes by providing a clear representation of the trade-offs involved in different options.
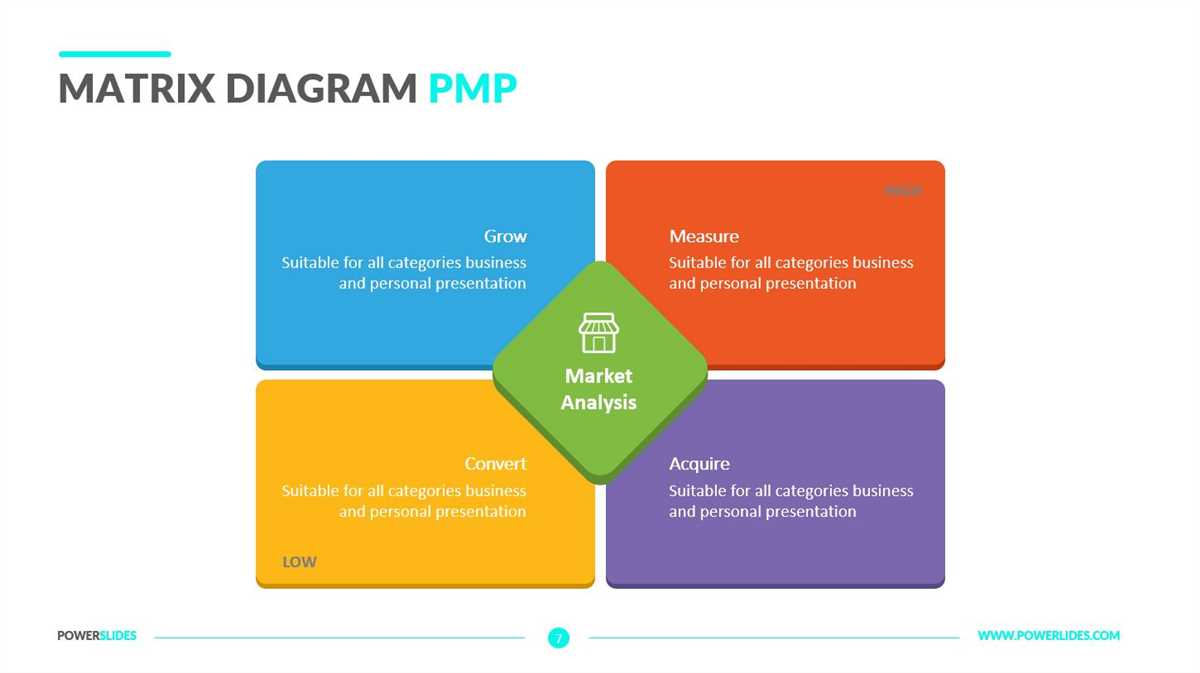
Influence Diagram PMP
An influence diagram is a graphical representation of the relationships between decision points, uncertainty, and objectives in a project management context. It helps project managers to visualize and understand the complex interdependencies and factors that may affect the success of their projects. An influence diagram provides a structured way to analyze and evaluate the potential impacts of different decisions and uncertainties on project outcomes.
One of the key benefits of using an influence diagram in project management is its ability to identify and prioritize the most critical factors and decision points that may influence project success. By mapping out the relationships and dependencies between various project elements, project managers can gain insights into the potential risks and opportunities associated with different decisions. This allows them to make more informed and effective decisions, allocate resources appropriately, and mitigate potential risks before they escalate into major issues.
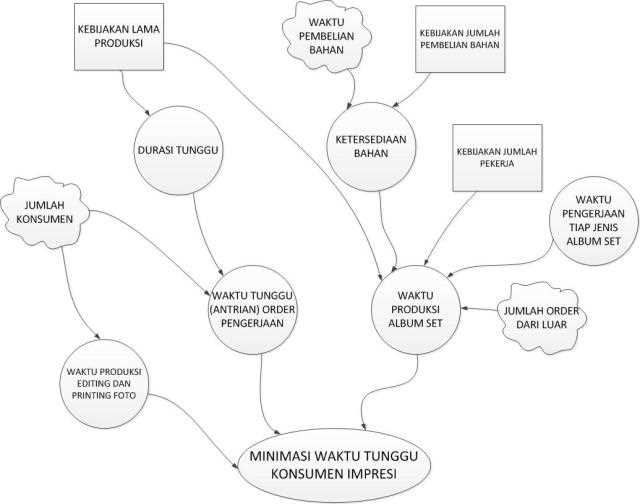
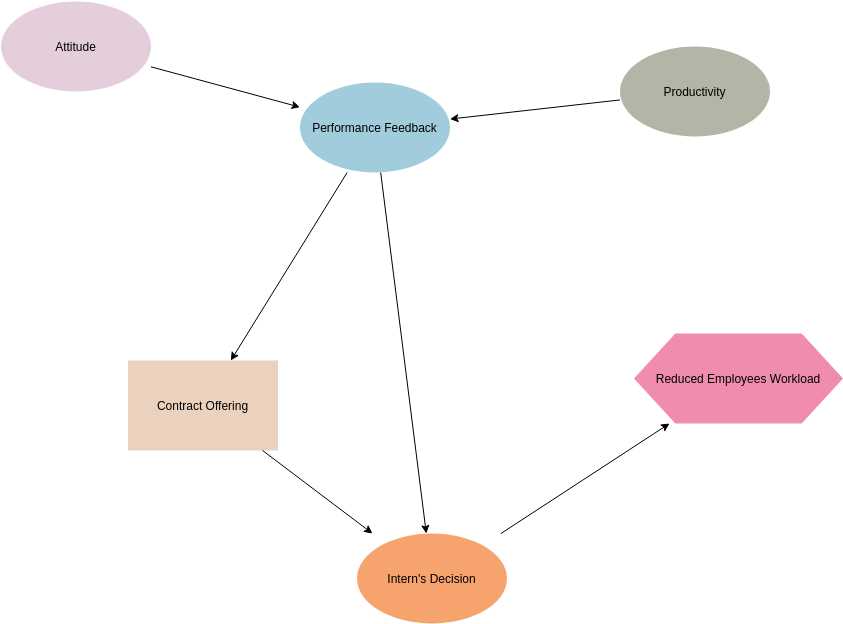
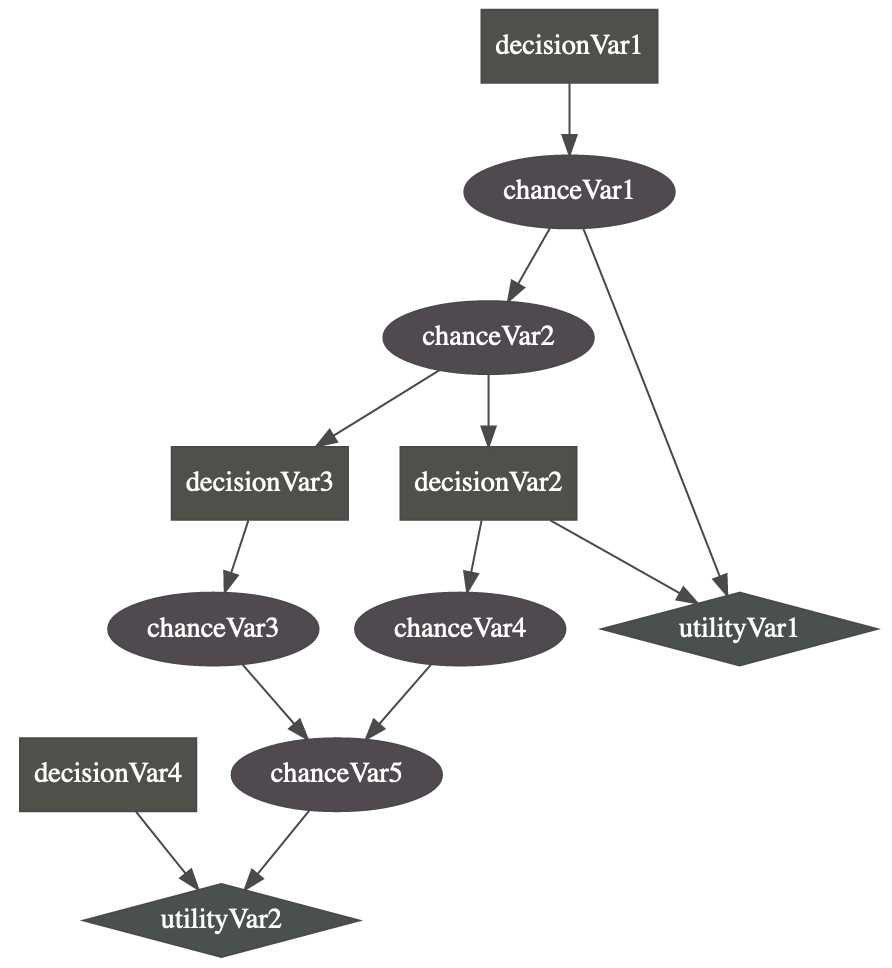
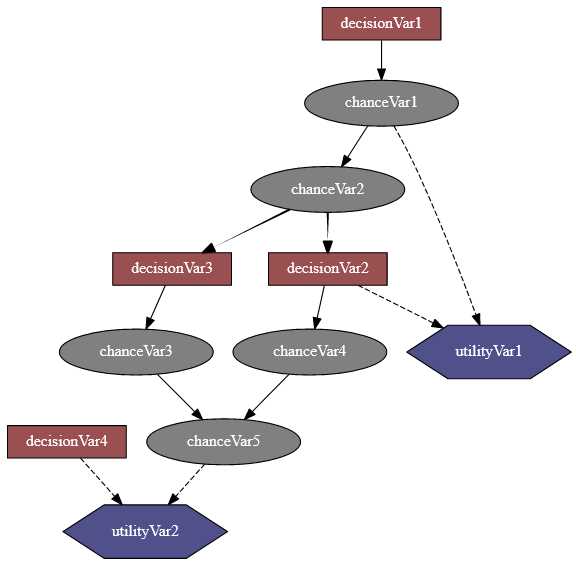
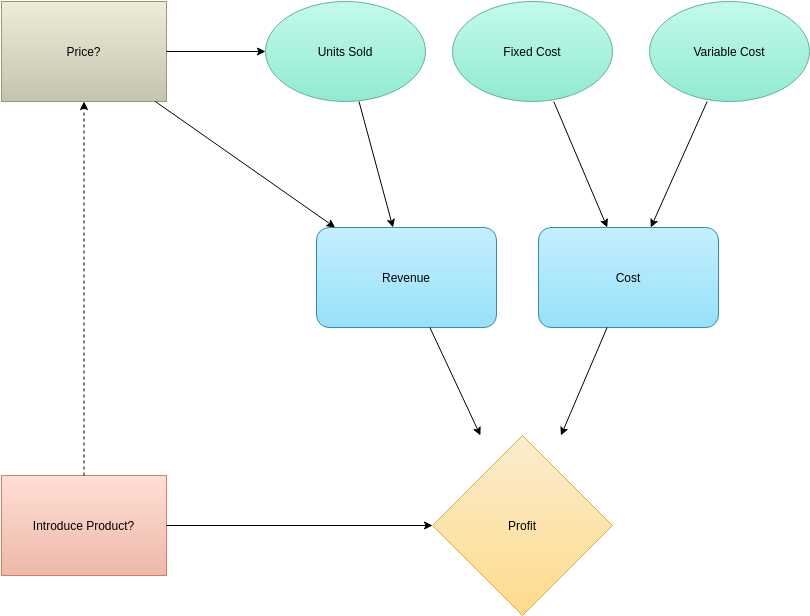
When creating an influence diagram, project managers typically use various symbols and arrows to represent decision points, uncertainties, dependencies, and objectives. Decision points are represented by squares or rectangles, uncertainties by circles or ovals, dependencies by arrows, and objectives by diamonds or rhombuses. The arrows indicate the influence or relationship between different elements, whether it is a cause-and-effect relationship, a dependency, or a decision option.
Overall, an influence diagram is a powerful tool for project managers to analyze and evaluate the potential impacts of different factors on project outcomes. It helps them to make better decisions, manage risks more effectively, and achieve project success. By visualizing the complex relationships and interdependencies within a project, project managers can effectively navigate through uncertainties and make informed choices that align with project objectives.
What is an Influence Diagram and how is it used in Project Management?
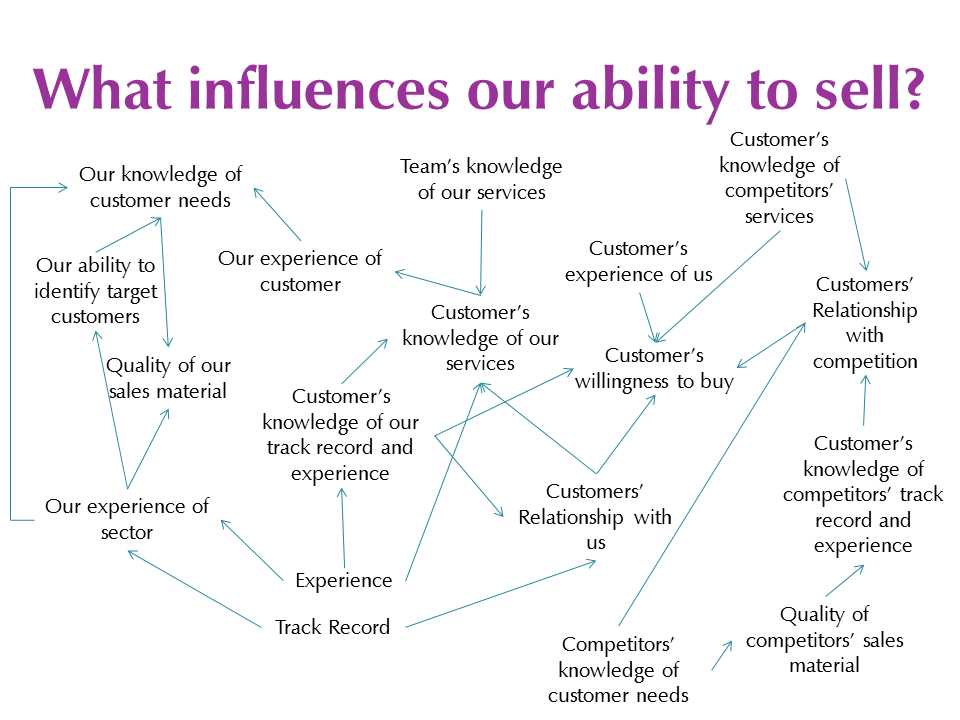
An Influence Diagram, also known as a decision diagram or an influence network, is a graphical representation that depicts the relationships between different factors or variables in a project. It is commonly used in project management to analyze and understand the cause-and-effect relationships that exist within a project and to make informed decisions based on this analysis.
The main purpose of an Influence Diagram in project management is to help project managers identify and evaluate the various factors that can impact the success or failure of a project. It allows them to visually map out the dependencies, uncertainties, risks, and opportunities associated with different project variables, such as tasks, resources, stakeholders, and external factors.
By creating an Influence Diagram, project managers can gain a better understanding of how different project variables interact with each other and how changes in one variable can affect others. This allows them to identify potential bottlenecks, risks, or opportunities in the project and make data-driven decisions to mitigate risks, optimize resource allocation, and improve project outcomes.
The Influence Diagram can also be used to perform sensitivity analysis, scenario planning, and decision-making under uncertainty. It provides project managers with a visual tool to model different project scenarios and evaluate the potential outcomes of different decisions or actions. By simulating various scenarios and analyzing the corresponding impacts, project managers can make more informed decisions and minimize the potential negative consequences of their choices.
In conclusion, an Influence Diagram is a valuable tool in project management that facilitates the analysis and understanding of complex relationships and factors within a project. It helps project managers make informed decisions, mitigate risks, optimize resource allocation, and improve project outcomes.
Key Components of an Influence Diagram
An influence diagram is a graphical representation of a decision problem. It consists of several key components that help in understanding and analyzing the decision-making process. These components include nodes, arcs, decision variables, uncertain variables, objectives, and constraints.
1. Nodes: Nodes are the building blocks of an influence diagram. They represent the decision points, uncertain events, and the outcomes of the decision problem. Decision nodes are depicted as squares, uncertain nodes as circles, and objective nodes as triangles.
2. Arcs: Arcs show the relationships between the nodes in an influence diagram. They represent the cause-and-effect relationships, as well as the influence one variable has on another. Arcs can be directed or undirected, depending on the nature of the relationship between the nodes.
3. Decision variables: Decision variables represent the choices or actions that the decision maker can take. They are associated with decision nodes and are usually represented by rectangles with the label of the decision variable.
4. Uncertain variables: Uncertain variables represent the events or factors that are not under the control of the decision maker and have uncertain outcomes. They are associated with uncertain nodes and are usually represented by circles with the label of the uncertain variable.
5. Objectives: Objectives represent the goals or objectives of the decision maker. They are associated with objective nodes and are usually represented by triangles with the label of the objective.
6. Constraints: Constraints represent the limitations or restrictions on the decision problem. They can be mathematical equations, logical conditions, or qualitative constraints that need to be satisfied. Constraints are typically represented by inequality signs or other symbols that indicate the nature of the constraint.
In summary, an influence diagram is a powerful tool for visualizing and analyzing decision problems. Its key components help in understanding the relationships between variables, identifying the decision options and uncertainties, and formulating the objectives and constraints of the decision-making process.
Benefits of Using Influence Diagrams in Project Management
Influence diagrams are powerful tools that can greatly enhance the decision-making process in project management. They provide a visual representation of the relationships and dependencies between different factors, helping project managers identify and prioritize the most critical elements.
One of the key benefits of using influence diagrams is that they allow project managers to understand the complex interactions and interdependencies within a project. By mapping out the relationships between various variables, such as tasks, resources, and risks, project managers can gain a comprehensive view of the project and make more informed decisions.
Improved Communication:
Influence diagrams can also improve communication within a project team. The visual nature of the diagrams makes it easier for stakeholders to understand and discuss the project, facilitating collaboration and alignment. By using influence diagrams, project managers can effectively communicate complex ideas and concepts, ensuring everyone is on the same page.
Risk Management:
Influence diagrams help project managers identify and assess potential risks and their impacts. By visually mapping out the relationship between risks and other project factors, project managers can proactively plan mitigation strategies and allocate resources accordingly. This proactive approach to risk management can help minimize the potential negative impacts on the project’s timeline, budget, and outcomes.
Optimized Decision Making:
With influence diagrams, project managers can evaluate different scenarios and assess the potential outcomes of each decision. By considering the various factors and their relationships, project managers can make more informed decisions that are aligned with the project’s objectives. This helps optimize the overall project performance and increases the likelihood of success.
In conclusion, influence diagrams are invaluable tools in project management as they provide a visual representation of the complex relationships and dependencies within a project. By using influence diagrams, project managers can improve communication, enhance risk management, and optimize decision-making, ultimately leading to the successful completion of projects.
Steps to Create an Influence Diagram in Project Management
An influence diagram is a powerful tool used in project management to visually represent the relationships between various factors that can influence the outcome of a project. By creating an influence diagram, project managers can gain valuable insights into the potential risks and opportunities associated with their projects. Here are the steps to create an influence diagram in project management:
1. Identify the project objectives and desired outcome
The first step in creating an influence diagram is to clearly define the project objectives and the desired outcome. This will help to narrow down the factors that need to be considered in the diagram.
2. Identify the key factors
Next, identify the key factors that can influence the outcome of the project. These factors can include external factors such as market conditions, competition, and regulatory changes, as well as internal factors such as resources, budget, and team capabilities.
3. Determine the relationships between the factors
Once the key factors have been identified, determine the relationships between them. This can be done through brainstorming sessions, interviews with stakeholders, or by conducting a thorough analysis of the project. The relationships can be represented using arrows or lines in the influence diagram.
4. Assess the impact of each factor
After determining the relationships, assess the impact of each factor on the outcome of the project. This can be done by assigning weights or probabilities to each factor based on their significance and likelihood of occurrence.
5. Create the influence diagram
Using the information gathered in the previous steps, create the influence diagram. The diagram should clearly depict the relationships between the factors and their impact on the outcome of the project. Use arrows or lines to show the direction of influence and include labels for each factor and relationship.
In conclusion, creating an influence diagram in project management involves identifying project objectives, identifying key factors, determining relationships between the factors, assessing the impact of each factor, and creating the diagram. By following these steps, project managers can gain a better understanding of the various influences on their projects and make informed decisions to ensure project success.
Common Mistakes to Avoid when Creating Influence Diagrams
When creating influence diagrams in project management, it is important to be aware of common mistakes that can occur. By avoiding these mistakes, you can ensure that your influence diagrams accurately represent the relationships and dependencies within your project. Here are some common mistakes to be cautious of:
- Incorrectly capturing dependencies: One common mistake is failing to accurately capture the dependencies between variables in the influence diagram. It is crucial to carefully consider the cause-and-effect relationships and clearly represent them in the diagram.
- Overcomplicating the diagram: Another mistake is creating an overly complex influence diagram. It is important to keep the diagram simple and concise, focusing only on the most relevant variables and relationships. This will make it easier to understand and interpret.
- Not considering uncertainties and risks: Ignoring uncertainties and risks is a common mistake in influence diagram creation. It is important to incorporate these factors into the diagram, as they can greatly impact the outcomes and decision-making process.
- Using inconsistent or unclear symbols: Inconsistency in symbol usage or unclear symbols can lead to confusion and misinterpretation of the influence diagram. It is crucial to define and consistently use symbols that accurately represent the variables, decisions, and relationships.
- Neglecting to update the diagram: A mistake that often occurs is failing to update the influence diagram as the project progresses or new information becomes available. It is important to regularly review and update the diagram to reflect the current state of the project.
Avoiding these common mistakes will help you create accurate and effective influence diagrams that provide valuable insights for project management. By properly capturing dependencies, keeping the diagram simple, considering uncertainties and risks, using clear symbols, and regularly updating the diagram, you can ensure that your influence diagram remains a useful tool throughout your project’s lifecycle.
Q&A:
What is an influence diagram?
An influence diagram is a graphical representation of a decision problem. It shows the relationships between different variables and decisions, as well as the influence each has on the outcome.
What are some common mistakes to avoid when creating influence diagrams?
Some common mistakes to avoid when creating influence diagrams include: not clearly defining the objectives and decisions, overlooking important variables or relationships, using inconsistent or unclear notation, and failing to consider the uncertainty or risk involved in the decision problem.
Why is it important to clearly define the objectives and decisions in an influence diagram?
Clear definition of objectives and decisions is important in an influence diagram because it determines the focus and scope of the decision problem. Without clear objectives and decisions, the diagram may become confusing and ineffective in analyzing and solving the problem.
What is the role of variables in an influence diagram?
Variables in an influence diagram represent the different factors that can affect the outcome of a decision problem. They are used to show the relationships and dependencies between different elements of the diagram, such as decisions, uncertainties, and objectives.
How does considering uncertainty or risk affect the creation of influence diagrams?
Considering uncertainty or risk in the creation of influence diagrams is important because it allows for a more thorough and accurate analysis of the decision problem. It helps to identify potential outcomes and their probabilities, and enables the decision-maker to make more informed choices based on the level of risk involved.