
An activity diagram is a type of UML (Unified Modeling Language) diagram that depicts the flow of activities within a system. In this case, the system is an online shopping system, where customers can browse and purchase products from an online store.
The activity diagram for an online shopping system would capture the various activities involved in the process, such as browsing products, adding items to cart, making a payment, and placing an order. It would also show the various paths and decisions that can be made during the process, such as choosing different payment methods or adding or removing items from the cart.
The main actors in the activity diagram for an online shopping system would be the customers and the online store. The customers would initiate the activities, such as selecting products and making a payment, while the online store would respond to these actions and carry out the corresponding processes, such as updating the inventory and processing the payment.
What is an activity diagram?
An activity diagram is a type of UML (Unified Modeling Language) diagram that represents a flow of activities or processes in a system. It is commonly used to visualize the behavior of a system or a specific process within a system. Activity diagrams are widely used in software development, especially in the analysis and design phases, to model and understand the workflow and interactions between different components or entities.
In an activity diagram, activities are represented by nodes or rounded rectangles, and the transitions between activities are represented by arrows. It provides a high-level view of the system’s flow and helps in understanding the sequential and parallel activities involved. The activities can represent the actions performed by different actors, such as users, systems, or external services. It can also depict conditional branching, concurrent activities, and loops, making it a powerful tool to visualize complex scenarios.
Activity diagrams are particularly useful for documenting and communicating the functionality of a system, as they provide a clear and concise representation of the system’s behavior. They can be used to understand the order of activities, identify decision points, and identify potential bottlenecks or areas of improvement in a process. Activity diagrams can also be used to validate the requirements of a system and ensure that the desired functionality and behavior are captured accurately.
Purpose of activity diagrams in online shopping systems
Activity diagrams are widely used in the design and development of online shopping systems. They provide a visual representation of the various activities and processes that occur within the system and help to clarify the overall flow of the system.
One of the main purposes of activity diagrams in online shopping systems is to model the different steps and interactions involved in the shopping process. These diagrams allow designers to understand the sequence of actions that a user takes when browsing and purchasing products on an online platform. From the initial search and product selection to the final checkout and payment, activity diagrams capture the entire customer journey.
In addition to illustrating the customer’s perspective, activity diagrams also help to highlight the interactions between the user and the system itself. They can show how the system processes and handles user input, such as adding items to the shopping cart or applying discounts. By visualizing these interactions, designers can identify potential bottlenecks or areas for improvement in the system’s functionality.
Furthermore, activity diagrams are useful for communicating and documenting the online shopping system’s behavior to stakeholders and developers. These diagrams provide a clear and concise overview of the system’s functionality, making it easier for team members to understand and discuss the different activities. They can also serve as a reference for future development or troubleshooting, ensuring that the system’s behavior remains consistent over time.
In conclusion, activity diagrams play a crucial role in modeling and designing online shopping systems. They help to visualize the customer journey, highlight system interactions, and communicate the system’s behavior to stakeholders and developers. By using activity diagrams, designers can ensure that the online shopping experience is seamless and efficient for users.
Components of an activity diagram
An activity diagram is a behavioral diagram that represents the flow of activities in a system, such as an online shopping system. It visually depicts the activities, actions, and decisions that occur during the execution of a business process. The key components of an activity diagram include:
- Initial node: It represents the starting point of the activity diagram. It is depicted with a small solid circle.
- Action or activity: It represents a specific task or operation that is performed in the system. Each action is represented with a rectangular shape.
- Control flow arrow: It represents the flow of control from one action to another. It is depicted as an arrow connecting the actions.
- Decision diamond: It represents a decision point in the system where a condition is evaluated and different paths are taken based on the result. It is depicted as a diamond shape.
- Guard condition: It is a condition that determines which path to take at a decision point. It is represented as a boolean expression inside the diamond shape.
- Final node: It represents the end point of the activity diagram. It is depicted with a solid circle with a small dot inside.
These components are used to create the structure and flow of activities in an activity diagram. By visually representing the sequence of actions and decisions, activity diagrams provide a clear and concise overview of how a system operates and the various paths that can be taken during its execution.
Example of an activity diagram for online shopping system
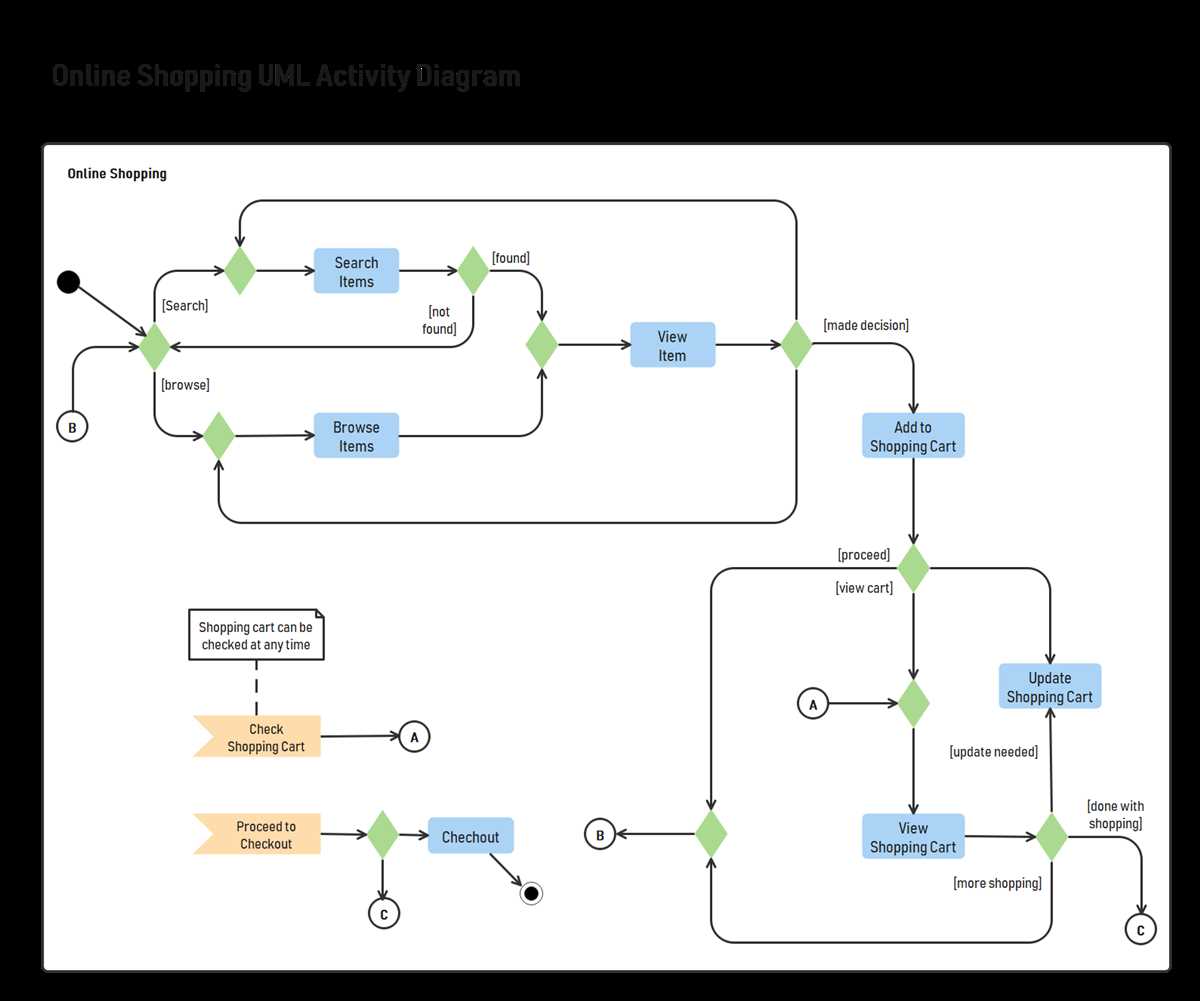
An activity diagram is a visual representation of the workflow or process flow within a system. It depicts the sequence of activities, decision points, and interactions between different entities or components. Here, we present an example of an activity diagram for an online shopping system that illustrates the steps involved in placing an order.
The diagram begins with the start activity, which represents the initiation of the online shopping process. The user then enters the website and proceeds to browse the available products. This is represented by the activity “Browse Products,” shown as a rectangular box with rounded corners. In this activity, the user can view the product catalog, filter products, and search for specific items.
After browsing products, the user selects the desired item and adds it to the shopping cart. This is represented by the activity “Add to Cart,” indicated by an arrow leading to a rectangle labeled “Shopping Cart.” Within the shopping cart, the user can modify the quantity of items, remove items, or proceed to checkout.
Upon proceeding to checkout, the user is prompted to provide the necessary information for shipping and payment. This is represented by the activity “Enter Shipping and Payment Details.” After entering the required details, the user confirms the order and proceeds to the payment process. This is shown as the activity “Make Payment,” indicated by another arrow leading to a rectangle labeled “Payment Gateway.”
Once the payment is successfully processed, the system generates an order confirmation and sends it to the user’s email address. This is represented by the activity “Send Order Confirmation.” The diagram then concludes with the end activity, representing the complete order placement process.
Overall, this activity diagram provides a clear and visual representation of the steps involved in placing an order in an online shopping system. It highlights the different activities and decision points, allowing stakeholders to better understand and analyze the workflow of the system.
Benefits of using activity diagrams in online shopping systems
The use of activity diagrams in online shopping systems provides several benefits. These diagrams allow developers and stakeholders to visually understand the flow of activities within the system, making it easier to identify and address any potential issues or bottlenecks. The benefits of using activity diagrams in online shopping systems can be summarized as follows:
- Easy visualization: Activity diagrams provide a clear and intuitive visual representation of the sequence of activities in an online shopping system. This makes it easier for developers and stakeholders to understand and communicate the system’s functionality and behavior.
- Identification of errors and inefficiencies: By analyzing the activity diagram, developers can identify any errors or inefficiencies in the flow of activities. This allows for timely improvements and optimizations to enhance the overall user experience and system performance.
- Improved communication: Activity diagrams serve as a common language between developers, stakeholders, and designers. They provide a visual representation that can be easily understood by all parties involved, facilitating effective communication and collaboration.
- Enhanced system design: Activity diagrams help in the design and planning phase of an online shopping system. They provide a structured representation of the system’s functionality, allowing developers to identify and define the necessary components and interactions.
- Easy documentation: Activity diagrams can serve as documentation for the online shopping system. They provide a clear and concise representation of the system’s activities, making it easier to maintain and update the documentation as the system evolves.
In conclusion, activity diagrams are a valuable tool in the development and analysis of online shopping systems. They provide a visual representation that enhances understanding, communication, and collaboration among stakeholders. By using activity diagrams, developers can identify and address any potential issues and inefficiencies, leading to an improved user experience and a more efficient and effective online shopping system.