
A root cause diagram is a powerful tool used in problem-solving and decision-making processes. It helps identify the underlying causes of an issue or problem, rather than just treating the symptoms. By examining the root causes, individuals and organizations can develop effective solutions that address the fundamental issues at hand.
Root cause diagrams are often used in various fields, including business, engineering, healthcare, and project management. They provide a visual representation of the cause-and-effect relationships between different factors contributing to a problem. This diagram allows stakeholders to see the big picture and understand how various elements interact with each other, leading to the issue at hand.
The process of creating a root cause diagram involves brainstorming and identifying potential causes, organizing them into categories, and then analyzing the relationships between these causes. The causes are typically represented as boxes or circles, connected by lines or arrows to show the causal relationships. The diagram may also include additional information, such as the severity or frequency of each cause.
By creating a root cause diagram, individuals and teams can gain a deeper understanding of a problem or issue, leading to more effective problem-solving and decision-making. It allows them to move beyond addressing the symptoms and tackle the root causes head-on, ultimately leading to long-term solutions and improvements.
What is a Root Cause Diagram and How Does it Work?
A root cause diagram, also known as a fishbone diagram or Ishikawa diagram, is a visual tool used to identify the root causes of a problem or issue. It is often used in quality management, problem-solving, and Six Sigma methodologies.
The diagram is named after its creator, Kaoru Ishikawa, a Japanese quality control expert. It takes the shape of a fishbone, with the problem or issue being the “head” of the fish and the potential root causes represented by the “bones.” Each bone is a category or factor that could contribute to the problem.
How does a root cause diagram work?
To create a root cause diagram, a team gathers to brainstorm and analyze potential root causes of a problem. The team determines the major categories or factors that could contribute to the problem and writes them as “bones” extending from the “head.”
These categories can include factors such as equipment, people, processes, materials, environment, or management. The team then further analyzes each category to identify specific causes or factors within each category, adding them as smaller “bones” branching off from the main categories. This process continues until the team has exhaustively identified potential root causes.
Benefits of using a root cause diagram:
- Visual representation: The diagram provides a visual representation of potential root causes, making it easier to understand and analyze complex problems.
- Collaborative problem-solving: The diagram encourages collaboration and brainstorming among team members, promoting a shared understanding of the problem and potential solutions.
- Identifying multiple causes: By breaking down the problem into categories and subcategories, the diagram helps identify multiple potential causes, allowing for a comprehensive analysis.
- Focus on the root cause: The diagram helps shift the focus from symptoms or immediate causes to the underlying root causes, allowing for more effective problem solving.
- Continuous improvement: The root cause diagram is a tool commonly used in continuous improvement efforts, helping identify and address underlying issues to prevent recurrence of problems.
In conclusion, a root cause diagram is a valuable tool for analyzing and solving problems by visually identifying potential root causes. It promotes collaborative problem solving, helps focus on underlying causes rather than symptoms, and supports continuous improvement efforts.
The Concept of Root Cause Analysis
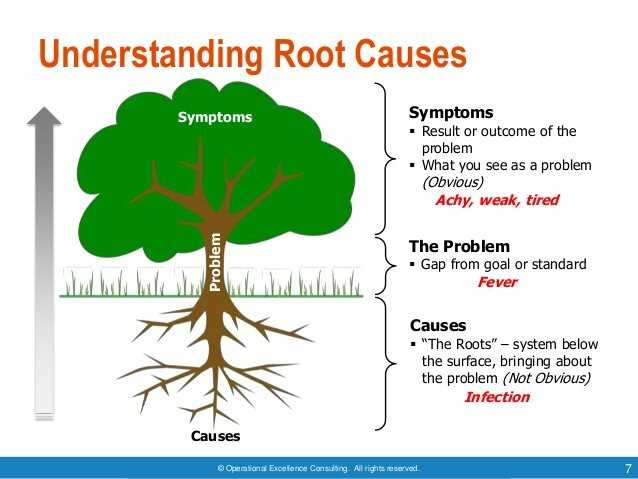
Root cause analysis is a systematic approach used to identify the underlying causes of a problem or an undesirable event. It is a powerful problem-solving tool that goes beyond addressing only the symptoms of an issue and focuses on finding the root cause that is responsible for its occurrence. By identifying and addressing the root cause, organizations can prevent the problem from recurring in the future and achieve long-term solutions.
At the core of root cause analysis is the belief that most problems are not isolated incidents but rather the result of a chain of events or factors. The goal of the analysis is to trace back the series of causes and effects to identify the key factors that led to the problem. This involves analyzing data, conducting investigations, and engaging in critical thinking to determine the factors that contributed most significantly to the problem.
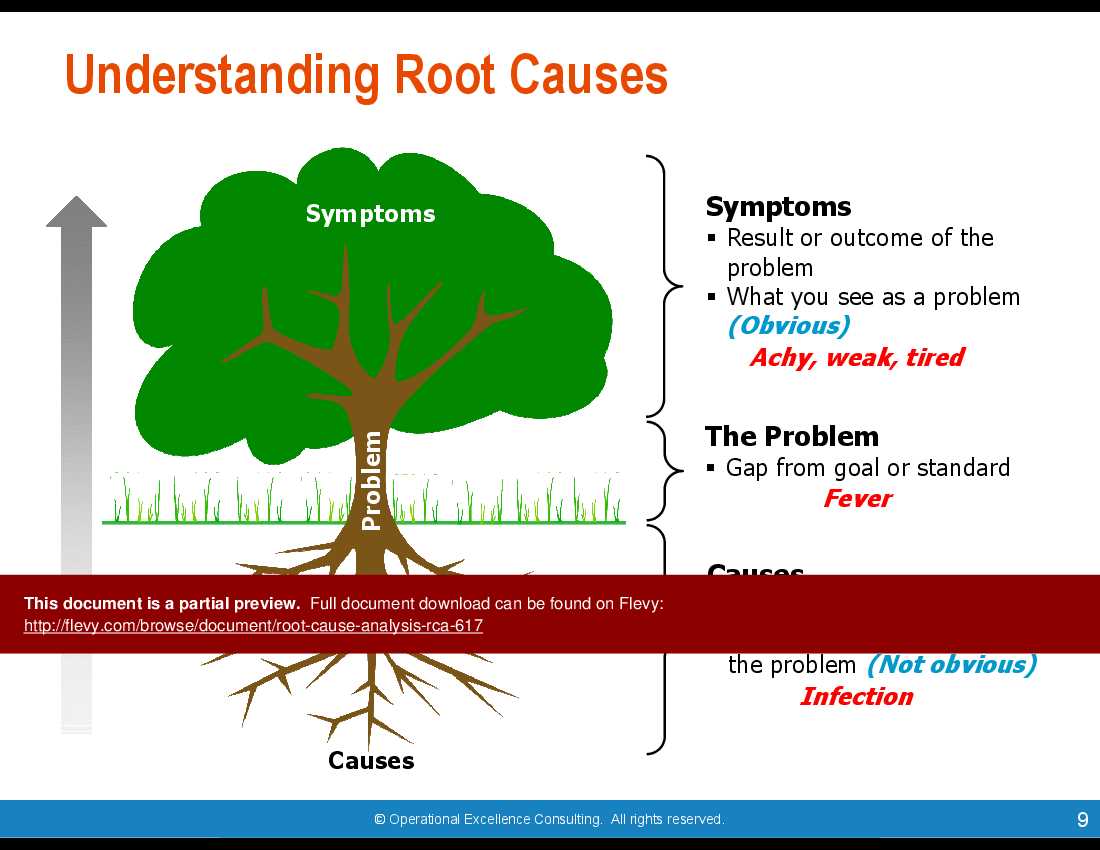
In the context of root cause analysis, the concept of “root cause” refers to the fundamental reason or core issue that, if addressed and resolved, will prevent the problem from occurring again. It is important to distinguish the root cause from the immediate cause or symptoms, which are often more visible but do not address the underlying issue. By addressing the root cause, organizations can implement targeted solutions that will have a lasting impact and result in continuous improvement.
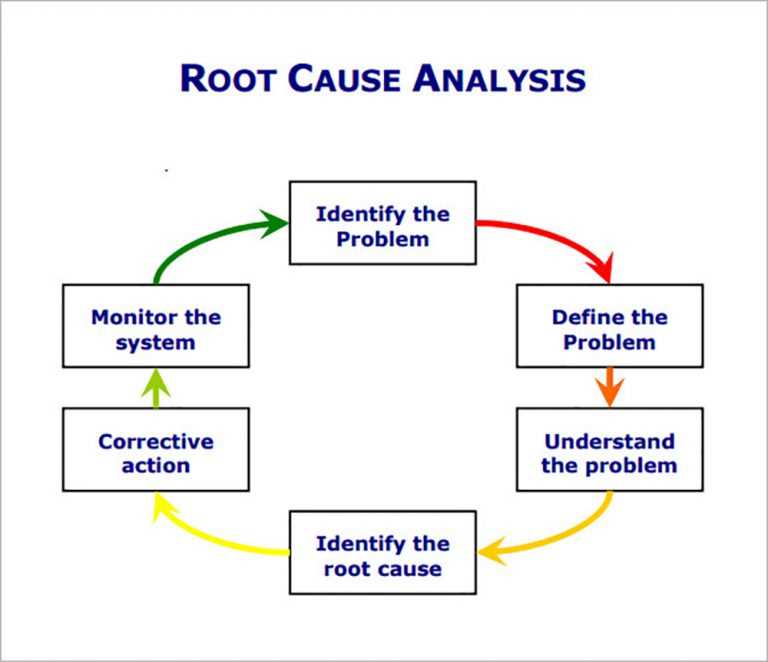
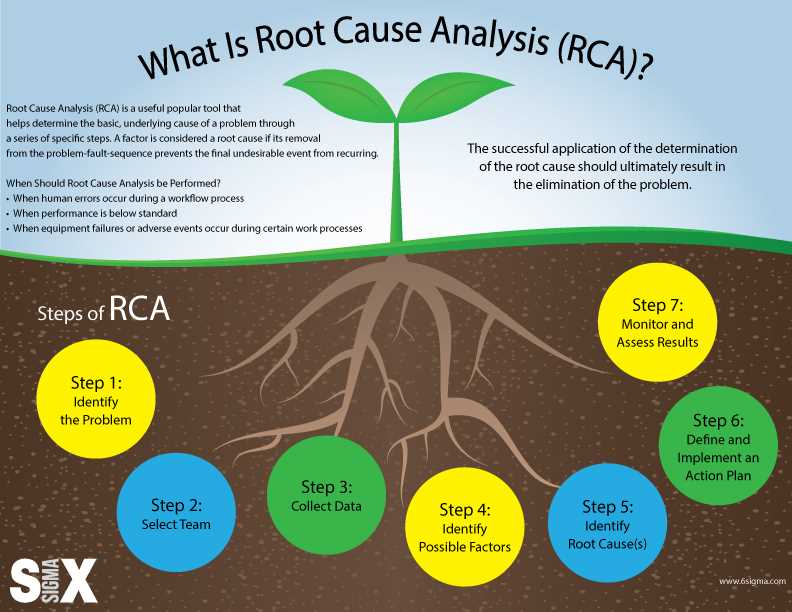
The process of root cause analysis typically involves several steps, including identifying the problem, collecting data and evidence, analyzing the data, identifying potential causes, prioritizing the most likely causes, and implementing corrective actions. These steps may be facilitated using various techniques and tools, such as cause and effect diagrams, brainstorming sessions, interviews, and data analysis methods.
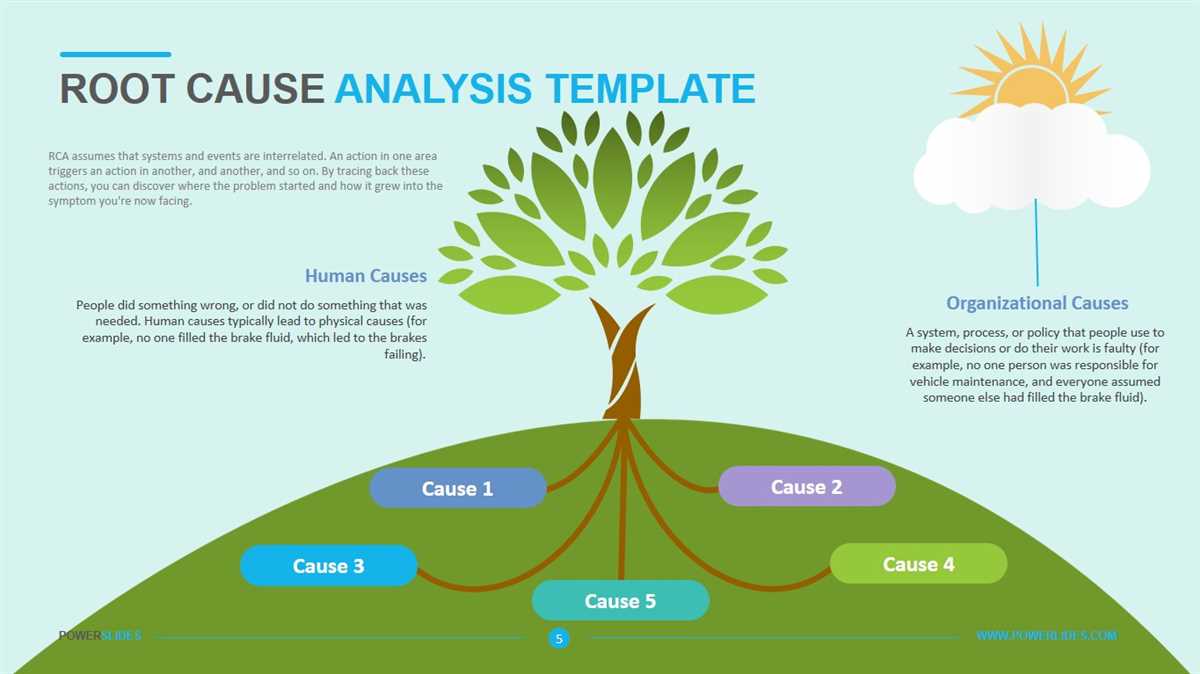
Understanding the Components of a Root Cause Diagram
A root cause diagram, also known as a fishbone diagram or Ishikawa diagram, is a valuable tool in identifying the underlying causes of a problem or issue. It allows individuals or teams to visually map out the various factors that contribute to a particular outcome, helping to identify the root cause or causes that need to be addressed.
Components of a Root Cause Diagram
1. Effect or Problem Statement: At the head of the diagram, the problem or effect that needs to be addressed is stated clearly. This serves as the focal point of the diagram and helps to keep the team’s focus on the specific issue at hand.
2. Major Categories: The major categories are the main branches extending from the spine of the fishbone diagram. These categories are typically chosen based on the nature of the problem being analyzed and could include categories such as people, process, equipment, environment, or management. Each category represents a potential cause or factor that may contribute to the problem.
3. Causes: Under each major category, specific causes or factors are identified. These causes can be further broken down into sub-causes or contributing factors. Each cause or factor is written as a separate branch stemming from the corresponding category. It is important to list all possible causes and factors to ensure a comprehensive analysis.
4. Sub-Causes: When necessary, sub-causes or contributing factors can be added below each cause. This allows for a more detailed analysis and provides a clearer understanding of the complex relationships between different factors.
5. Relationships: Arrows are used to show the relationships between different causes and factors. These arrows illustrate how one factor may contribute to or be influenced by another. By visualizing these relationships, teams can better understand the interconnectedness of different factors and identify potential areas for improvement.
6. Analysis: Once the root cause diagram is complete, teams can analyze the various causes and factors identified to determine the most probable root cause or causes. This analysis may involve further investigation, data analysis, or problem-solving techniques to validate the identified root causes.
A root cause diagram provides a structured approach to problem-solving and encourages collaboration and brainstorming. By visually mapping out the causes and relationships, teams can gain a deeper understanding of the problem at hand and develop effective strategies to address the root causes.
Benefits of Using Root Cause Diagrams
Root cause diagrams, also known as Ishikawa or fishbone diagrams, are invaluable tools for identifying the underlying causes of a problem or issue. By visually mapping out the possible causes and their relationships, these diagrams can help teams gain a deeper understanding of the contributing factors and develop more effective solutions. Here are some key benefits of using root cause diagrams:
1. Identifying the root cause
A major advantage of root cause diagrams is that they help to identify the primary cause of a problem. By breaking down the factors into categories such as people, process, equipment, materials, and environment, teams can systematically analyze each area and identify the possible root causes. This can prevent the team from solely focusing on symptoms and instead address the underlying issues that lead to the problem.
2. Promoting cross-functional collaboration
Root cause diagrams can be created collaboratively, involving individuals from different departments or areas of expertise. This promotes cross-functional collaboration and brings diverse perspectives to the problem-solving process. By involving stakeholders with different backgrounds, knowledge, and skills, the team can gain a more comprehensive understanding of the problem and develop a more effective solution.
3. Visual representation of complex problems
Often, complex problems have multiple causes that are intricately connected. Root cause diagrams provide a visual representation of these relationships, making it easier for the team to understand, analyze, and communicate the complexity of the problem. The diagram structure allows for a clear visualization of cause and effect relationships, enabling the team to prioritize the most critical causes and focus their efforts on those areas.
4. Facilitating problem-solving discussions
Root cause diagrams serve as a tool for facilitators to guide problem-solving discussions. By displaying the various causes and their relationships, the diagram can help keep the discussion focused and structured. It ensures that all potential causes are considered and encourages the team to critically analyze each one. The diagram also facilitates brainstorming sessions, allowing participants to add causes and potential solutions to the diagram in real-time.
In conclusion, root cause diagrams are valuable tools that provide several benefits in the problem-solving process. They aid in identifying the root cause of a problem, promote cross-functional collaboration, visually represent complex problems, and facilitate meaningful discussions. By leveraging these benefits, teams can develop more effective solutions and prevent recurring issues in the future.
Steps to Create a Root Cause Diagram
Creating a root cause diagram is an effective way to identify the underlying causes of a problem or issue. It helps to visualize the relationship between various factors and determine the root cause that is responsible for the problem. Here are the steps to create a root cause diagram:
- Define the Problem: Clearly define the problem or issue that needs to be addressed. This will serve as the starting point for creating the root cause diagram.
- Brainstorm Possible Causes: Gather a team of individuals who are knowledgeable about the problem and conduct a brainstorming session to identify possible causes. Encourage everyone to contribute ideas and write them down.
- Organize Causes into Categories: Once you have a list of possible causes, group them into categories based on their similarities. This will help in organizing the information and identifying common themes.
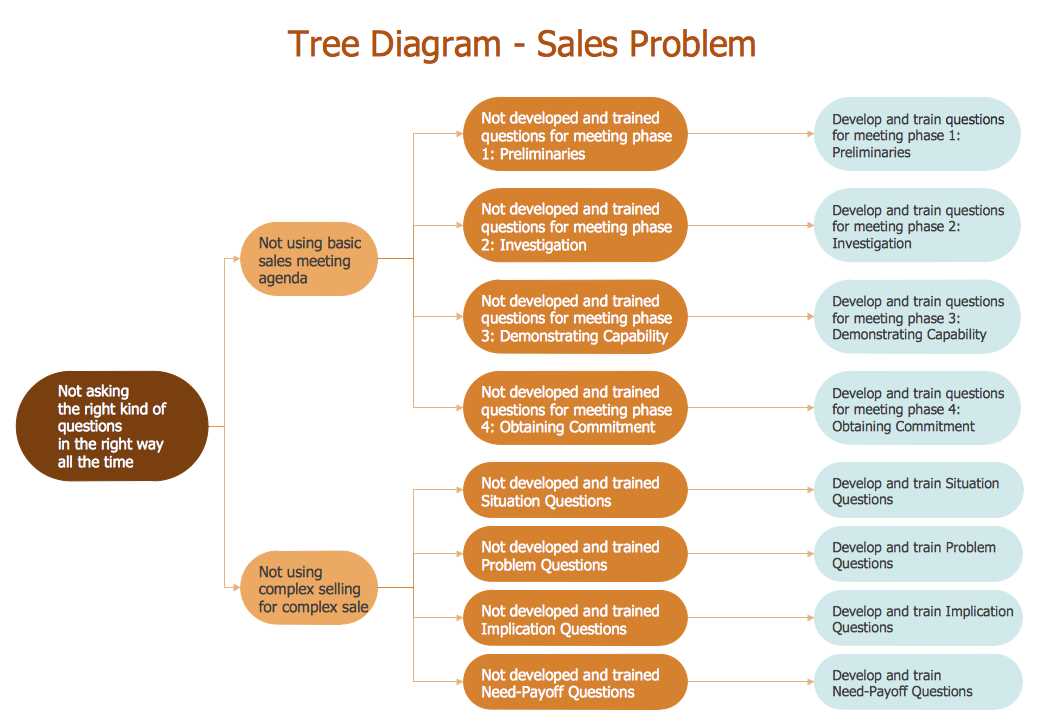
- Create the Diagram: Decide on the format of the root cause diagram, such as a fishbone diagram or a tree diagram. Use the chosen format to visually represent the relationship between the problem and its potential causes.
- Identify the Root Cause: Analyze the diagram to identify the root cause or causes of the problem. Look for causes that have the most significant impact or are common to multiple branches of the diagram.
- Validate the Root Cause: Once you have identified the root cause, validate it by gathering additional data or conducting further analysis. This will help to ensure that the root cause is accurate and not based on assumptions.
- Develop Actionable Solutions: Based on the identified root cause, develop actionable solutions to address the problem. These solutions should directly target the root cause to effectively resolve the issue.
- Implement and Monitor: Implement the chosen solutions and monitor their effectiveness. Continuously assess the impact of the solutions and make adjustments as necessary to ensure desired outcomes.
By following these steps, you can create a comprehensive root cause diagram that provides insights into the underlying causes of a problem and facilitates the development of targeted solutions. It is an essential tool in problem-solving and continuous improvement processes.
Real-Life Examples of Root Cause Diagrams
A root cause diagram, also known as a fishbone diagram or Ishikawa diagram, is a powerful tool used in various industries to identify the underlying causes of a problem or an event. Here are some real-life examples of how root cause diagrams have been implemented:
1. Manufacturing Industry
In the manufacturing industry, root cause diagrams are commonly used to identify the causes of product defects or equipment failures. By mapping out the potential causes under different categories such as materials, methods, machines, manpower, and environment, manufacturers can target specific areas for improvement and implement effective preventive measures.
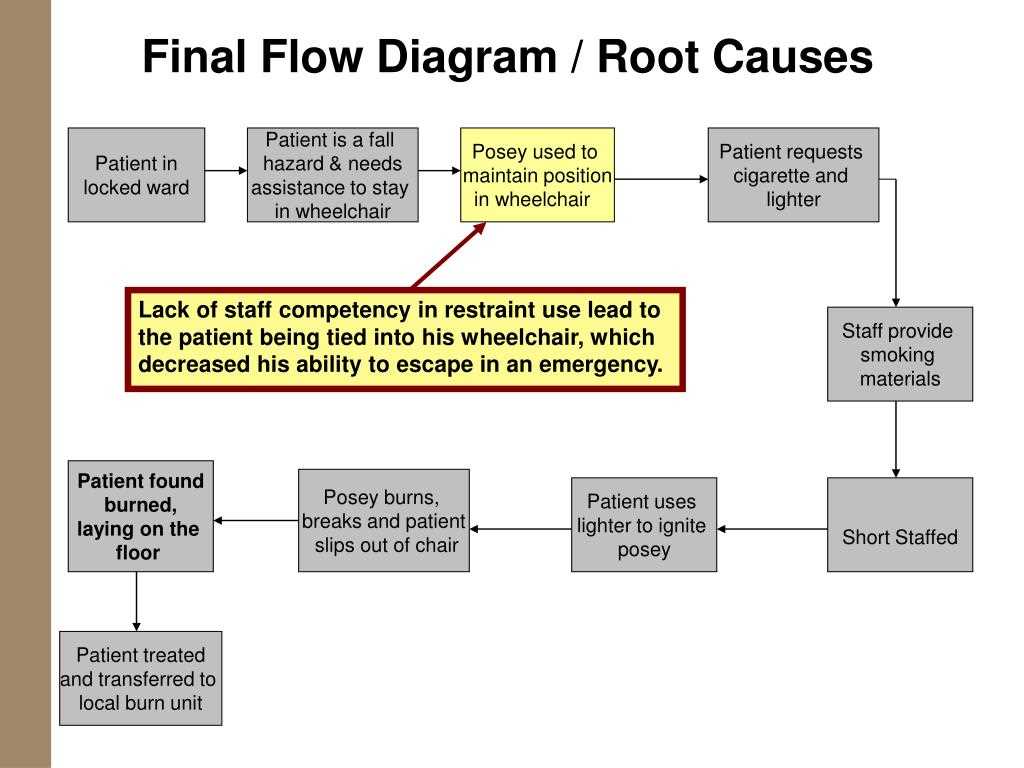
2. Healthcare Industry
In the healthcare industry, root cause diagrams are utilized to identify the causes of medical errors, patient falls, and other adverse events. By analyzing factors like communication breakdowns, equipment failures, and human factors, healthcare providers can implement strategies to enhance patient safety and minimize errors.
3. IT Industry
In the IT industry, root cause diagrams are often used to troubleshoot system failures, software bugs, and network issues. By analyzing categories like hardware, software, networks, and personnel, IT professionals can identify the root causes and implement appropriate corrective actions to prevent future failures.
Conclusion
Root cause diagrams are versatile tools that can be applied in various industries to analyze and address complex problems. By visually mapping out the potential causes and their relationships, organizations can target the root causes of issues and implement effective solutions. Whether it’s in manufacturing, healthcare, or IT, root cause diagrams serve as valuable tools for problem-solving and continuous improvement.