
A flow diagram is a visual representation of a process or system that shows the sequence of steps or operations. It is widely used in various fields, including engineering, computer science, and business, to illustrate how a process works or how different components interact with each other. Flow diagrams use symbols to represent different elements, and understanding these symbols and the rules for creating flow diagrams is crucial for effective communication and problem-solving.
There are several common symbols used in flow diagrams, each representing a specific action or object. Some of the most commonly used symbols include:
– Arrows: Arrows are used to show the direction of flow or movement in a process. They can be straight, curved, or bent, depending on the specific process being represented.
– Rectangles: Rectangles represent processes or actions. They are used to indicate a specific step or operation in the process flow. The name of the process or action is usually written inside the rectangle.
– Diamonds: Diamonds are used to represent decision points or branching in a process. They indicate that a choice needs to be made based on a certain condition or criteria. The different branches or options are usually labeled with relevant information.
– Circles or ovals: Circles or ovals represent the start or end points of a process. They indicate where the process begins or ends.
When creating flow diagrams, there are certain rules that need to be followed to ensure clarity and consistency. These rules include:
– Flow from left to right: Flow diagrams are usually read from left to right, with the start point on the left and the end point on the right. This helps in understanding the sequence of steps or operations.
– Use clear and concise labels: All symbols and labels used in the flow diagram should be clear and easily understandable. This helps in avoiding confusion and facilitates effective communication.
– Consistent symbol usage: It is important to use the same symbols consistently throughout the flow diagram. This helps in maintaining clarity and avoids misinterpretation of the diagram.
– Include relevant information: The flow diagram should include all relevant information and details necessary to understand the process or system being represented. This includes labels, annotations, and additional notes wherever required.
By understanding the symbols and following the rules for creating flow diagrams, individuals can effectively communicate complex processes and systems, identify areas of improvement, and make informed decisions.
Flow Diagram Symbols and Rules
Flow diagrams are graphical representations of a process or system that help visualize the sequence of steps and decision points. These diagrams are widely used in various fields, including engineering, computer science, and business analysis. To create an effective flow diagram, it is essential to understand the different symbols and rules used in its construction.
Basic Symbols:
- The oval shape represents the start or end of a process.
- A rectangle signifies a process or an action that takes place.
- The diamond shape indicates a decision point where a choice needs to be made.
- An arrow represents the flow of the process from one step to another.
Flow Direction and Rules:
- Flowcharts generally read from top to bottom and from left to right to maintain consistency.
- Arrows should be used to show the direction of the flow, ensuring the process follows a logical sequence.
- Lines connecting different symbols should be labeled with a concise description of the action or decision being represented.
By using these symbols and following the established rules, flow diagrams become a valuable tool for understanding complex processes and identifying potential bottlenecks or inefficiencies. They provide a clear and visual representation that can be easily shared and understood by different stakeholders.
In conclusion, flow diagram symbols and rules enable the creation of effective and comprehensive flowcharts. These diagrams aid in the analysis and optimization of processes, leading to increased efficiency and improved decision-making.
The Importance of Flow Diagram Symbols
Flow diagrams are essential tools for visualizing processes, systems, and workflows. They provide a clear and concise representation of the different steps and actions involved in a particular process. However, in order to effectively communicate information through flow diagrams, it is important to use standardized symbols that convey specific meanings.
Flow diagram symbols serve as a universal language that enables individuals from various backgrounds and industries to understand and interpret the information presented. These symbols are designed to be easily recognized and understood, allowing for efficient communication and collaboration among team members.
Using flow diagram symbols helps to eliminate ambiguity and confusion, ensuring that all stakeholders have a clear understanding of the process being depicted. Each symbol represents a specific action or decision, such as a process step, decision point, or input/output. By using these symbols consistently, flow diagrams can effectively communicate complex processes in a simple and straightforward manner.
Additionally, flow diagram symbols enable the identification of potential bottlenecks or inefficiencies in a process. By visually mapping out a process and analyzing the flow of inputs and outputs, stakeholders can quickly identify areas of improvement and make informed decisions to optimize efficiency and productivity.
In conclusion, flow diagram symbols play a crucial role in the creation and understanding of flow diagrams. They provide a standardized language that facilitates effective communication and collaboration, eliminates ambiguity, and allows for the identification of process inefficiencies. By using these symbols correctly, individuals can effectively communicate complex processes and improve overall efficiency and productivity.
Commonly Used Flow Diagram Symbols
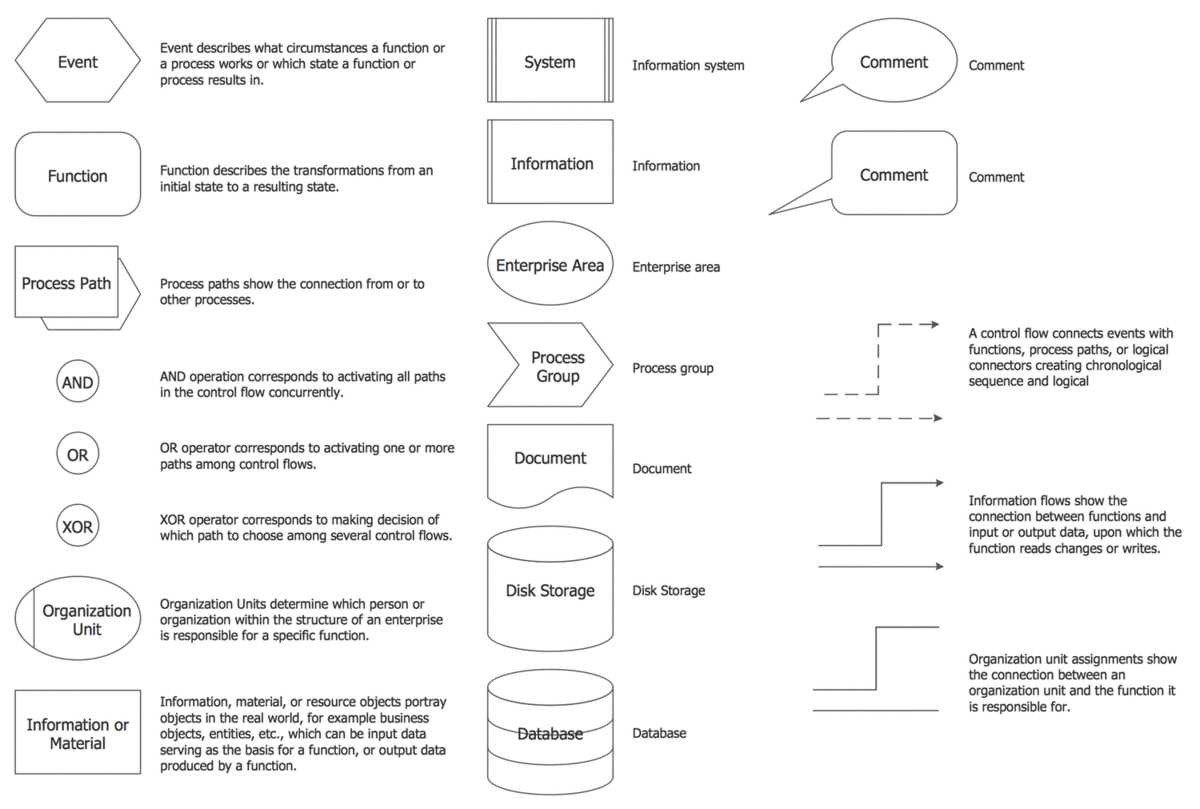
Flow diagrams are visual representations of processes, systems, or data flows. They use various symbols to represent different elements and actions within the diagram. Understanding these symbols is essential for interpreting and creating flow diagrams effectively. Here are some commonly used symbols in flow diagrams:
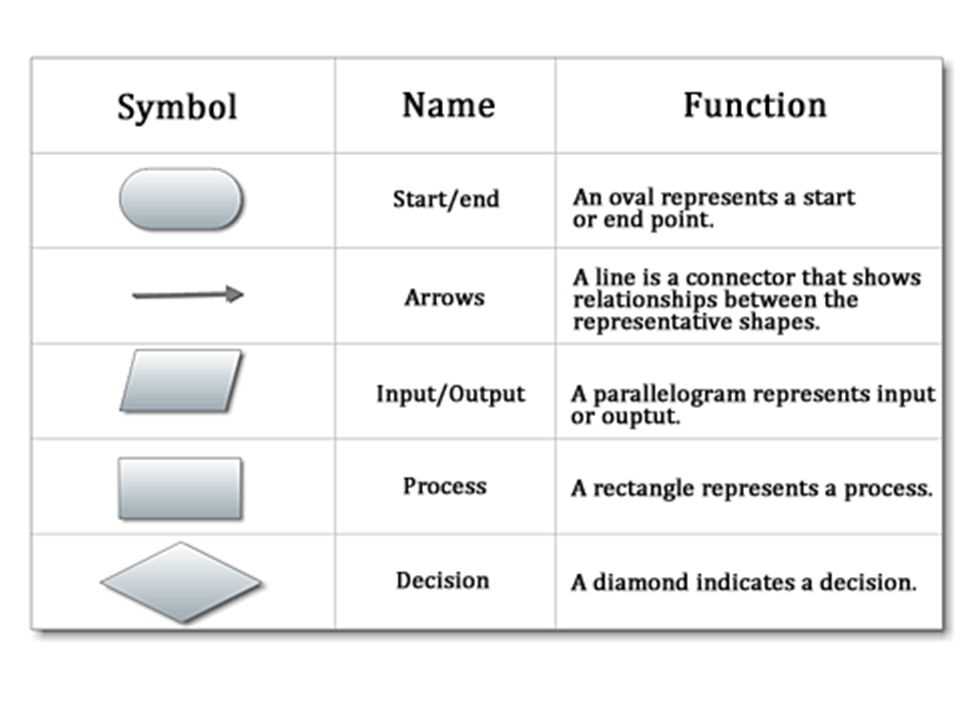
- Start/End Symbol: This symbol is used to represent the beginning or end of a process. It is typically represented by a circle or oval shape, often labeled with the word “Start” or “End”.
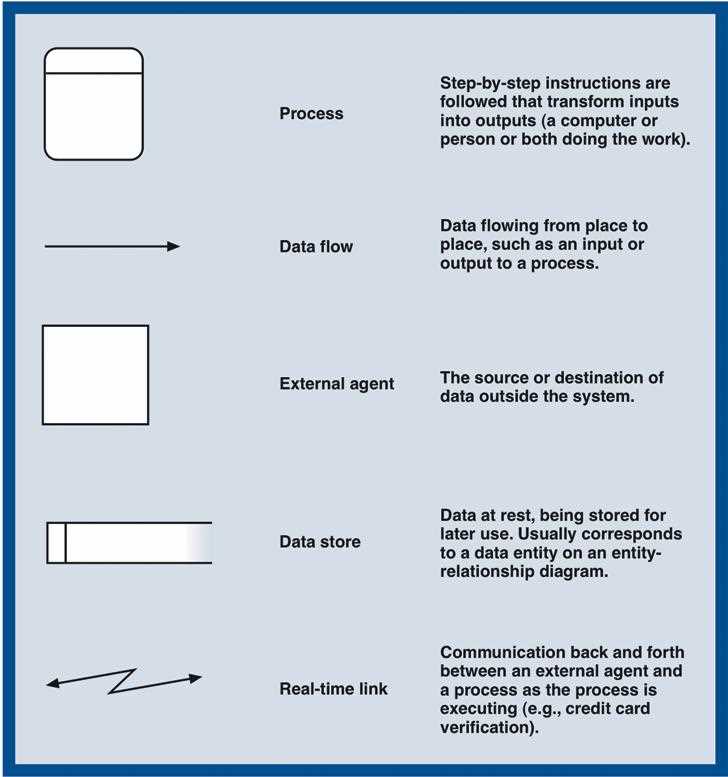
- Process Symbol: The process symbol represents an action or step in the process. It is usually depicted as a rectangle with rounded corners, and often contains a description of the specific action or step.
- Decision Symbol: This symbol is used when a decision needs to be made within the process. It is represented by a diamond shape, with different paths leading to different outcomes.
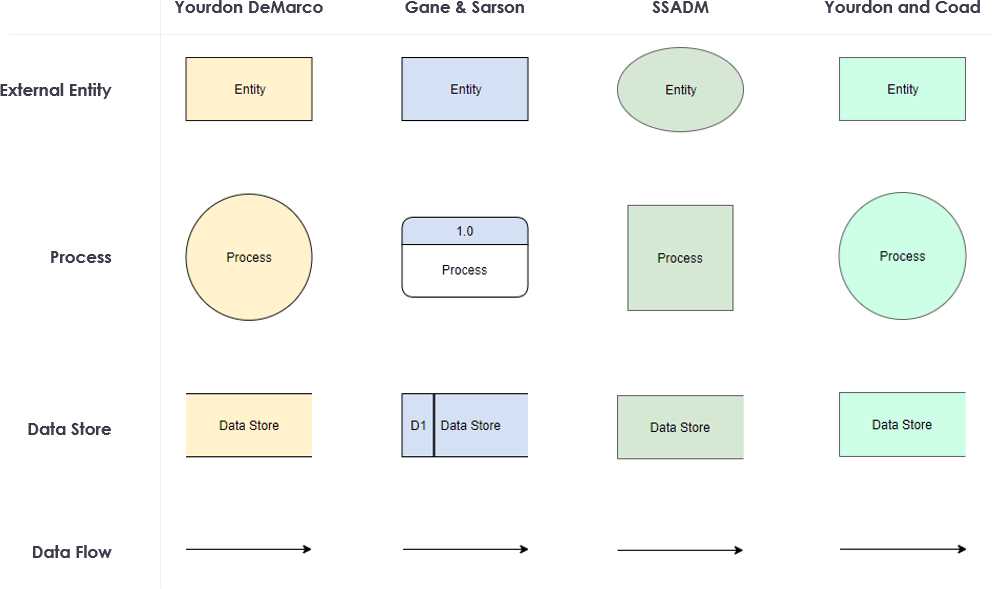
- Input/Output Symbol: The input/output symbol represents the flow of data or information into or out of a process. It is typically represented by a parallelogram shape, with arrows indicating the direction of the data flow.
- Connector Symbol: Connectors are used to show the flow of the process from one step to another. They are represented by arrows or lines that connect different symbols within the flow diagram.
In addition to these symbols, there are several other symbols that can be used in flow diagrams, depending on the specific needs of the diagram. These include symbols for loops, delays, storage, and more. It is important to familiarize oneself with the commonly used symbols and their meanings in order to create clear and effective flow diagrams.
Basic Rules for Creating Flow Diagrams
When creating flow diagrams, it is important to follow certain basic rules in order to ensure clarity and effectiveness. These rules provide guidance on how to use the various symbols and elements in flow diagrams.
Use Standard Symbols: Flow diagrams use specific symbols to represent different elements such as processes, decision points, start and end points, and data flow. It is important to use these standard symbols consistently throughout the diagram to avoid confusion and ensure clear communication.
Keep It Simple: Flow diagrams should be simple and easy to understand. Avoid unnecessary complexity and clutter. Stick to the key steps and elements that are essential to convey the intended message. This will make the diagram more accessible to a wider audience.
Flow from Top to Bottom: Flow diagrams typically follow a top-down structure, with the flow of information or processes moving from the top of the diagram to the bottom. This helps to maintain a logical sequence and keep the diagram organized. It is important to maintain this flow consistently throughout the diagram.
Use Arrows for Direction: Arrows are commonly used in flow diagrams to indicate the direction of flow. They can be used to show the movement of information, processes, or decisions. Arrows should be clear and easy to follow, helping the reader understand the flow of the diagram.
Provide Clear Labels and Descriptions: Each symbol and element in the flow diagram should have a clear label and description to ensure understanding. Use concise and descriptive labels that accurately convey the purpose or function of each element. This helps to clarify the meaning of the diagram and make it easier for the reader to interpret.
Review and Refine: After creating a flow diagram, it is important to review and refine it for clarity and accuracy. Check for any inconsistencies, ambiguities, or areas where the diagram can be improved. This iterative process helps to ensure that the final flow diagram is clear, concise, and effectively communicates the intended message.
Tips for Creating Effective Flow Diagrams
Flow diagrams are powerful tools for visualizing complex processes and systems. They can help you identify bottlenecks, inefficiencies, and opportunities for improvement. However, creating an effective flow diagram requires careful planning and attention to detail. Here are some tips to help you create flow diagrams that are clear, accurate, and easy to understand.
1. Use standardized symbols
Flow diagrams use a variety of symbols to represent different elements and actions. It’s important to use standardized symbols to ensure that your diagram is easily understandable by others. Familiarize yourself with common flow diagram symbols, such as rectangles for processes, diamonds for decision points, and arrows for flow direction.
2. Keep it simple
Avoid overcrowding your flow diagram with too many elements or information. Stick to the essential steps and actions to keep the diagram clear and easy to follow. Use concise labels and avoid unnecessary details. Remember that the purpose of the flow diagram is to simplify complex processes, so simplicity is key.
3. Arrange elements logically
Organize your flow diagram in a logical manner to enhance understanding. Place related elements and actions together and use arrows to show the flow of information or materials. Consider using swimlanes or color-coding to differentiate between different departments or responsibilities. A well-organized diagram will make it easier for viewers to follow the process.
4. Provide clear labels and descriptions
Make sure each element and action in your flow diagram is clearly labeled and described. Avoid using ambiguous terms or abbreviations that may confuse viewers. Use concise and descriptive labels to ensure that the flow of the process is easily understood. Consider including additional information or annotations if necessary.
5. Test and revise
Before finalizing your flow diagram, test it by walking through the process step by step. Make sure that the flow makes sense and accurately represents the actual process. Revise and refine your diagram as needed to improve clarity and accuracy. Show your diagram to others and gather feedback to ensure that it is easily understandable by different stakeholders.
By following these tips, you can create flow diagrams that effectively convey complex processes and systems. Remember to keep your diagrams clear, simple, and logical, and to provide clear labels and descriptions. With practice and attention to detail, you can become skilled in creating effective flow diagrams that help improve efficiency and understanding.
Examples of Flow Diagrams in Different Industries
Flow diagrams are widely used in various industries to represent processes, workflows, and systems. Here are some examples of flow diagrams in different industries:
- Manufacturing: In the manufacturing industry, flow diagrams are used to illustrate the production processes, including the steps involved in manufacturing a product. It helps in visualizing the workflow, identifying bottlenecks, and optimizing the production process.
- Software Development: Flow diagrams, such as flowcharts and UML diagrams, are commonly used in software development to represent the flow of control, data, and events within a program or system. It helps in understanding the logic of a software application and can be used for debugging and documentation purposes.
- Healthcare: Flow diagrams are used in healthcare to represent patient care pathways, treatment protocols, and medical workflows. It helps in visualizing the sequence of steps involved in the diagnosis, treatment, and monitoring of patients, improving the efficiency and quality of healthcare delivery.
- Logistics and Supply Chain: Flow diagrams are essential in logistics and supply chain management to represent the movement of goods, information, and resources throughout the supply chain. It helps in optimizing the flow of materials, coordinating activities, and improving overall supply chain performance.
- Business Process Management: Flow diagrams, such as process maps and swimlane diagrams, are widely used in business process management to capture, analyze, and model business processes. It helps in identifying inefficiencies, bottlenecks, and opportunities for process improvement, ultimately leading to enhanced organizational performance.
In conclusion, flow diagrams play a crucial role in various industries, serving as visual representations of processes, workflows, and systems. They help in understanding, analyzing, and optimizing complex systems and processes, resulting in improved efficiency, productivity, and overall performance.