
The Venn diagram is one of the most widely used tools in mathematics and logic to visually represent the relationships between different sets. It was first introduced by the mathematician John Venn in the late 19th century. A Venn diagram consists of overlapping circles or ellipses, with each circle representing a different set. The areas where the circles overlap represent the elements that are common to multiple sets.
In a Venn diagram for 4 sets, four circles or ellipses are used to represent the four sets. The area where all four circles overlap is known as the intersection of the four sets and represents the elements that are common to all four sets. The areas where three circles overlap represent the elements that are common to three out of the four sets. The areas where two circles overlap represent the elements that are common to two out of the four sets.
There are specific formulas that can be used to calculate the number of elements in each region of a Venn diagram for 4 sets. These formulas are based on the principle of inclusion and exclusion and can be quite complex. However, understanding these formulas can provide valuable insights into the relationships between different sets and can be used to solve various mathematical and logical problems.
Venn Diagram for 4 Sets Formula
A Venn diagram is a powerful tool used in mathematics and logic to represent relationships between sets. It consists of overlapping circles or ellipses that represent the sets, and the areas where the circles intersect represent the elements that are common to the sets.
Traditionally, Venn diagrams are used to represent relationships between two or three sets, but they can also be extended to represent relationships between four sets. In a Venn diagram for four sets, four overlapping circles are used to depict the sets and their intersections.
To calculate the number of elements in each region of a Venn diagram for four sets, we can use the inclusion-exclusion principle. This principle states that the number of elements in the union of four sets is equal to the sum of the number of elements in each set, minus the sum of the number of elements in each pairwise intersection, plus the number of elements in the intersection of all four sets.
In formula form, the equation can be expressed as:
n(A ∪ B ∪ C ∪ D) = n(A) + n(B) + n(C) + n(D) – n(A ∩ B) – n(A ∩ C) – n(A ∩ D) – n(B ∩ C) – n(B ∩ D) – n(C ∩ D) + n(A ∩ B ∩ C) + n(A ∩ B ∩ D) + n(A ∩ C ∩ D) + n(B ∩ C ∩ D) – n(A ∩ B ∩ C ∩ D)
Using this formula, we can calculate the number of elements in each region of the Venn diagram for four sets and analyze the relationships between the sets in a more complex way.
What is a Venn Diagram?
A Venn diagram is a visual representation of the relationships between different sets of data. It is composed of overlapping circles or ellipses, each representing a separate set or category. The overlapping regions of the circles indicate the similarities and intersections between the sets, while the non-overlapping regions represent the unique elements of each set.
Venn diagrams are commonly used in mathematics, logic, statistics, and other fields to illustrate the concepts of set theory and the relationships between different groups of objects or events. They provide a clear and concise way to organize and compare data, making it easier to understand complex relationships and make logical deductions.
A basic Venn diagram consists of two overlapping circles, representing two sets, and the overlapping region represents the elements that belong to both sets. As the number of sets increases, more circles are added to the diagram, and the overlapping regions become more complex. A Venn diagram with four sets, for example, can be used to analyze the relationships between four different categories or groups of data.
Using a Venn diagram, it is possible to determine the elements that are unique to each set, as well as the elements that are shared by two or more sets. This can be useful in various contexts, such as analyzing survey data, identifying common characteristics or traits among different populations, or solving logical problems that involve multiple conditions or criteria.
Overall, Venn diagrams are a powerful tool for visually organizing and analyzing data. They offer a simple yet effective way to represent the relationships between different sets, making complex information more accessible and facilitating the process of understanding and interpreting data.
Visualization of Four Sets in a Venn Diagram
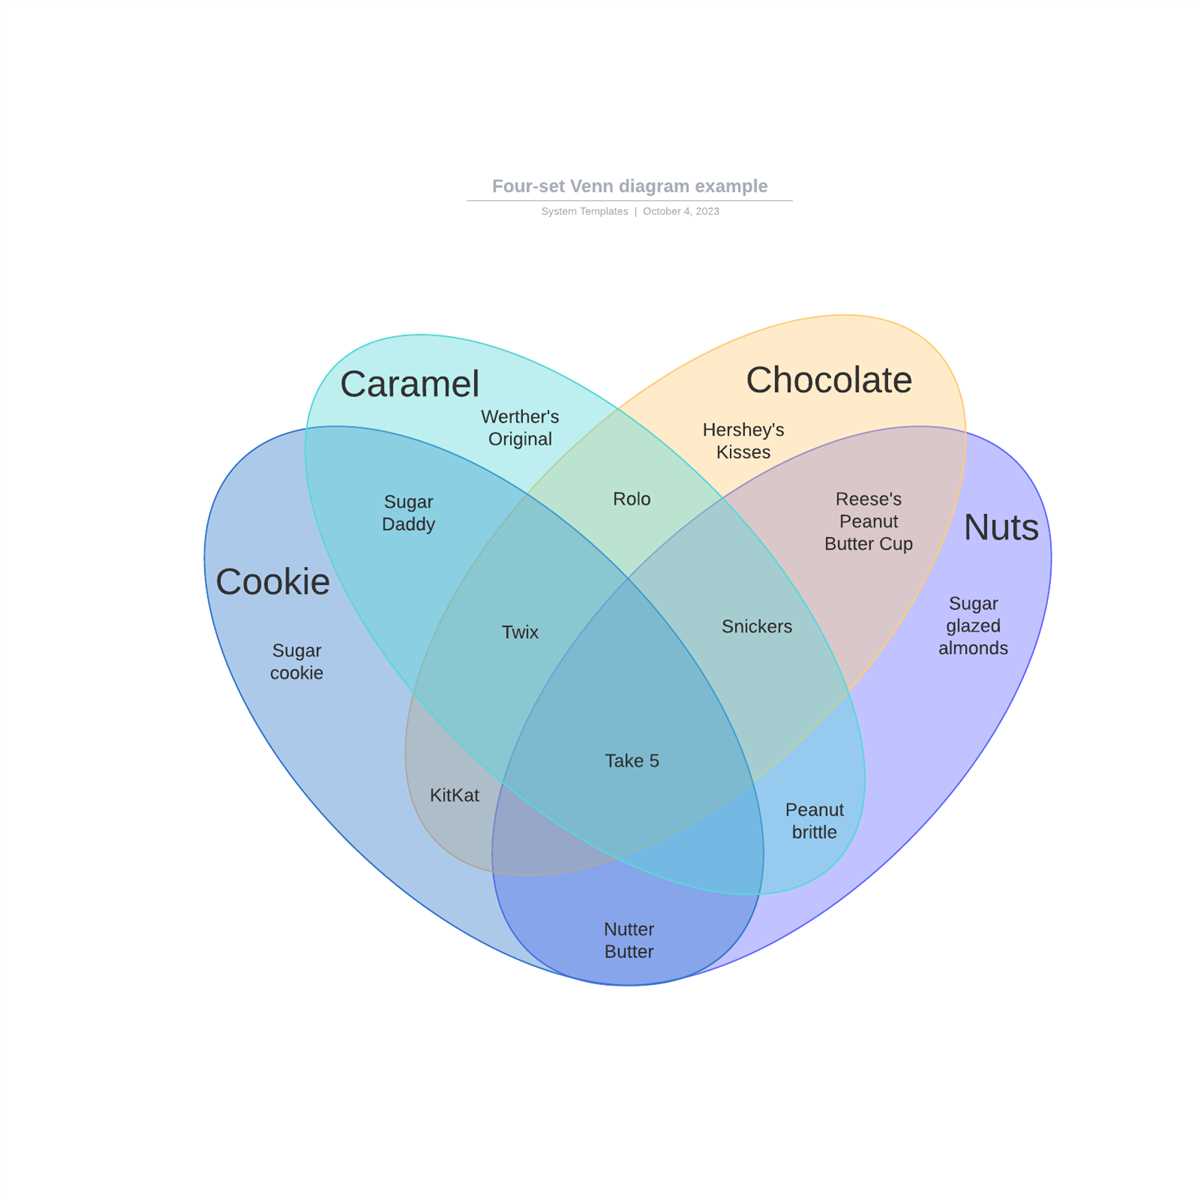
A Venn diagram is a useful tool for visualizing the relationships and intersections between multiple sets. While the traditional Venn diagram represents the relationships between two or three sets, it is also possible to create a Venn diagram that represents four sets. This can be achieved by adding an extra circle to the diagram, creating a four-circle Venn diagram.
In a four-circle Venn diagram, each circle represents a separate set, and the areas where the circles overlap represent the intersections between the sets. The intersections can be numbered or labeled to indicate the specific combination of sets they represent. This allows for a clear visual representation of the relationships and overlaps between the four sets.
In order to create a four-circle Venn diagram, it is important to carefully plan and determine the relationships between the sets. Each set should be distinct and have its own unique elements, while also having the potential for overlaps and intersections with the other sets. This will ensure that the Venn diagram accurately represents the relationships between the four sets.
By using different colors or shading for each of the circles, it is possible to further enhance the clarity of the Venn diagram. This allows for easier differentiation between the sets and their intersections. Additionally, labels or numbers can be added to the diagram to provide further information or context for the relationships between the sets.
Overall, a four-circle Venn diagram provides a powerful visual representation of the relationships and intersections between four sets. It allows for a quick and easy understanding of how the sets are related, and where their overlaps occur. This can be particularly useful in areas such as data analysis, statistics, and set theory, where understanding the relationships between multiple sets is essential.
How to Create a Venn Diagram for 4 Sets

Venn diagrams are visual tools that help organize and understand the relationships between different sets of data. They are commonly used in mathematics, logic, and statistics. While the traditional Venn diagram consists of two or three sets, it is also possible to create a diagram for four sets. Here’s how you can do it:
Step 1: Understand the Sets
In order to create a Venn diagram for four sets, you first need to have a clear understanding of the four sets and their relationships. Identify the elements that belong to each set and determine if there are any common elements or overlaps between the sets.
Step 2: Draw the Basic Structure
Start by drawing a large rectangle to represent the universal set. This will contain all the elements from the four individual sets. Divide the rectangle into four equal parts to represent the four sets.
Step 3: Add Elements
Now, add the elements of each set within their respective sections of the diagram. Make sure to include any overlapping elements in the appropriate areas where the sets intersect. This will help visualize the relationships and overlaps between the sets.
Step 4: Label the Diagram
To make the diagram easier to understand, label each section with the name or symbol of the corresponding set. You can also label the overlapping areas to indicate the elements that belong to multiple sets.
Step 5: Enhance and Customize
Finally, you can add further details or customize the Venn diagram to suit your needs. You may use different colors or patterns to distinguish between the sets and their overlaps. You can also add a legend or additional information to provide context or explain the meaning of the diagram.
By following these steps, you can create a Venn diagram for four sets that effectively represents and visualizes the relationships between them. Such diagrams can be particularly useful in areas such as data analysis, decision making, and problem-solving.
Formula for Calculating the Number of Regions in a 4-Set Venn Diagram
The number of regions in a 4-set Venn diagram can be calculated using a formula that takes into account the intersections of the sets. In a Venn diagram, each set is represented by a circle, and the overlapping sections represent the intersections between the sets.
To calculate the number of regions in a 4-set Venn diagram, the formula is as follows: R = 2^4 – 1. In this formula, “R” represents the number of regions in the diagram, and “^” represents exponentiation, meaning that the number 2 is raised to the power of 4.
In the case of a 4-set Venn diagram, there are four circles representing the sets, and each circle can either be present or absent in any given region. The formula accounts for all possible combinations of circle presence or absence, resulting in the total number of regions.
By substituting the value of 4 into the formula, we can calculate the number of regions in a 4-set Venn diagram: R = 2^4 – 1 = 16 – 1 = 15. Therefore, a 4-set Venn diagram will have a total of 15 regions.
Application of 4-Set Venn Diagrams in Various Fields
4-set Venn diagrams are powerful tools that can be applied in a wide range of fields to illustrate relationships and analyze complex data sets. The application of these diagrams goes beyond simple representation, and they are commonly used in mathematics, statistics, computer science, biology, and social sciences.
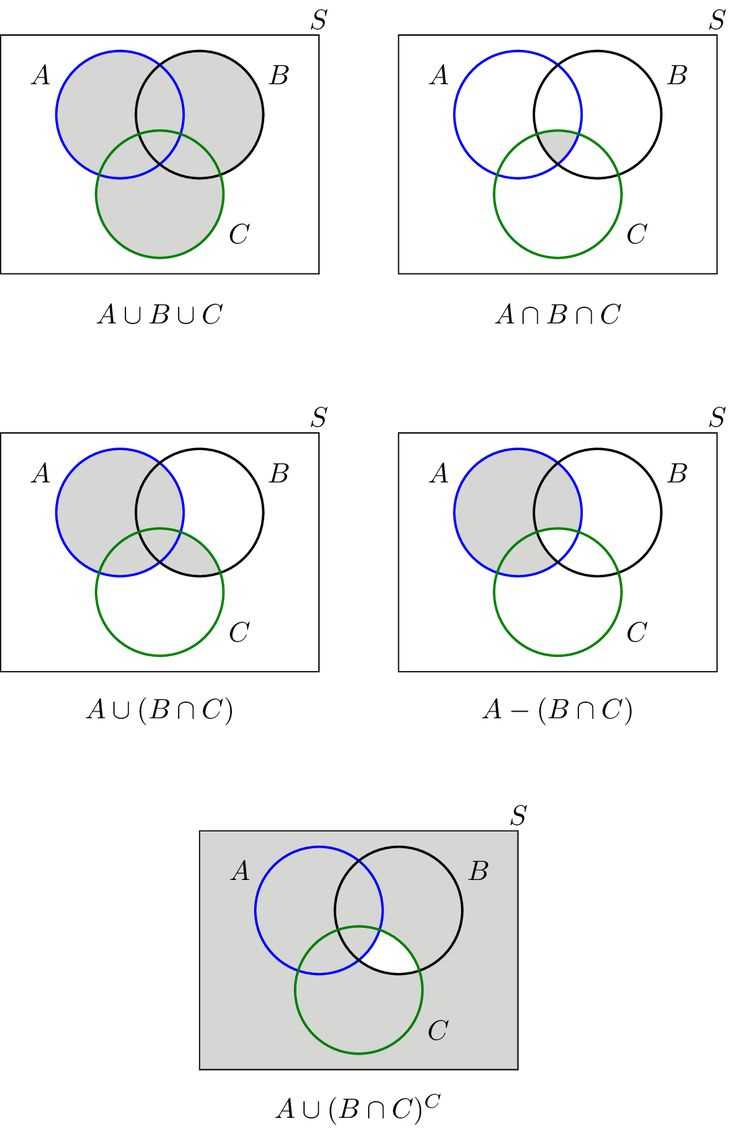
Mathematics: In mathematics, 4-set Venn diagrams are helpful for visualizing and solving problems related to set theory, logic, and number theory. They can be used to represent various mathematical concepts, such as intersections, unions, complements, and subsets, allowing mathematicians to analyze complex relationships between multiple sets.
Statistics: Venn diagrams are frequently used in statistics to display overlapping data sets and identify patterns or relationships between variables. They can be utilized to illustrate the results of surveys, experiments, or statistical analyses, allowing researchers to visualize the intersection or union of different populations or events.
Computer Science: Venn diagrams have several applications in computer science, particularly in the field of database management. They can be used to design and optimize relational databases, representing the relationships between tables, entities, and attributes. Venn diagrams are also employed in data visualization techniques and can aid in understanding complex algorithms and decision-making processes.
Biology: In biology, 4-set Venn diagrams can be used to study genetic inheritance, analyze gene expression data, or compare different species. They can assist researchers in understanding and visualizing the relationships between multiple genes, traits, or organisms, facilitating the identification of commonalities and differences between various biological systems.
Social Sciences: Venn diagrams are useful tools in the social sciences for understanding and analyzing complex social structures, relationships, and interactions. They can be utilized to study social networks, analyze the overlap between different cultural or demographic groups, or explore the connections between various social phenomena.
In conclusion, 4-set Venn diagrams have a wide range of applications in various fields, including mathematics, statistics, computer science, biology, and social sciences. They provide a visual representation of complex data sets, allowing for the analysis of relationships, intersections, and unions between multiple sets. By utilizing these diagrams, researchers and professionals can gain valuable insights and make informed decisions based on the visualization of data and relationships.