In the field of petrology, ultramafic rocks play a crucial role in understanding the Earth’s mantle and the processes that occur beneath the surface. These rocks are composed primarily of minerals rich in magnesium and iron, with low silica content. The ultramafic ternary diagram is a graphical representation that allows geologists to classify and interpret the compositions of these rocks.
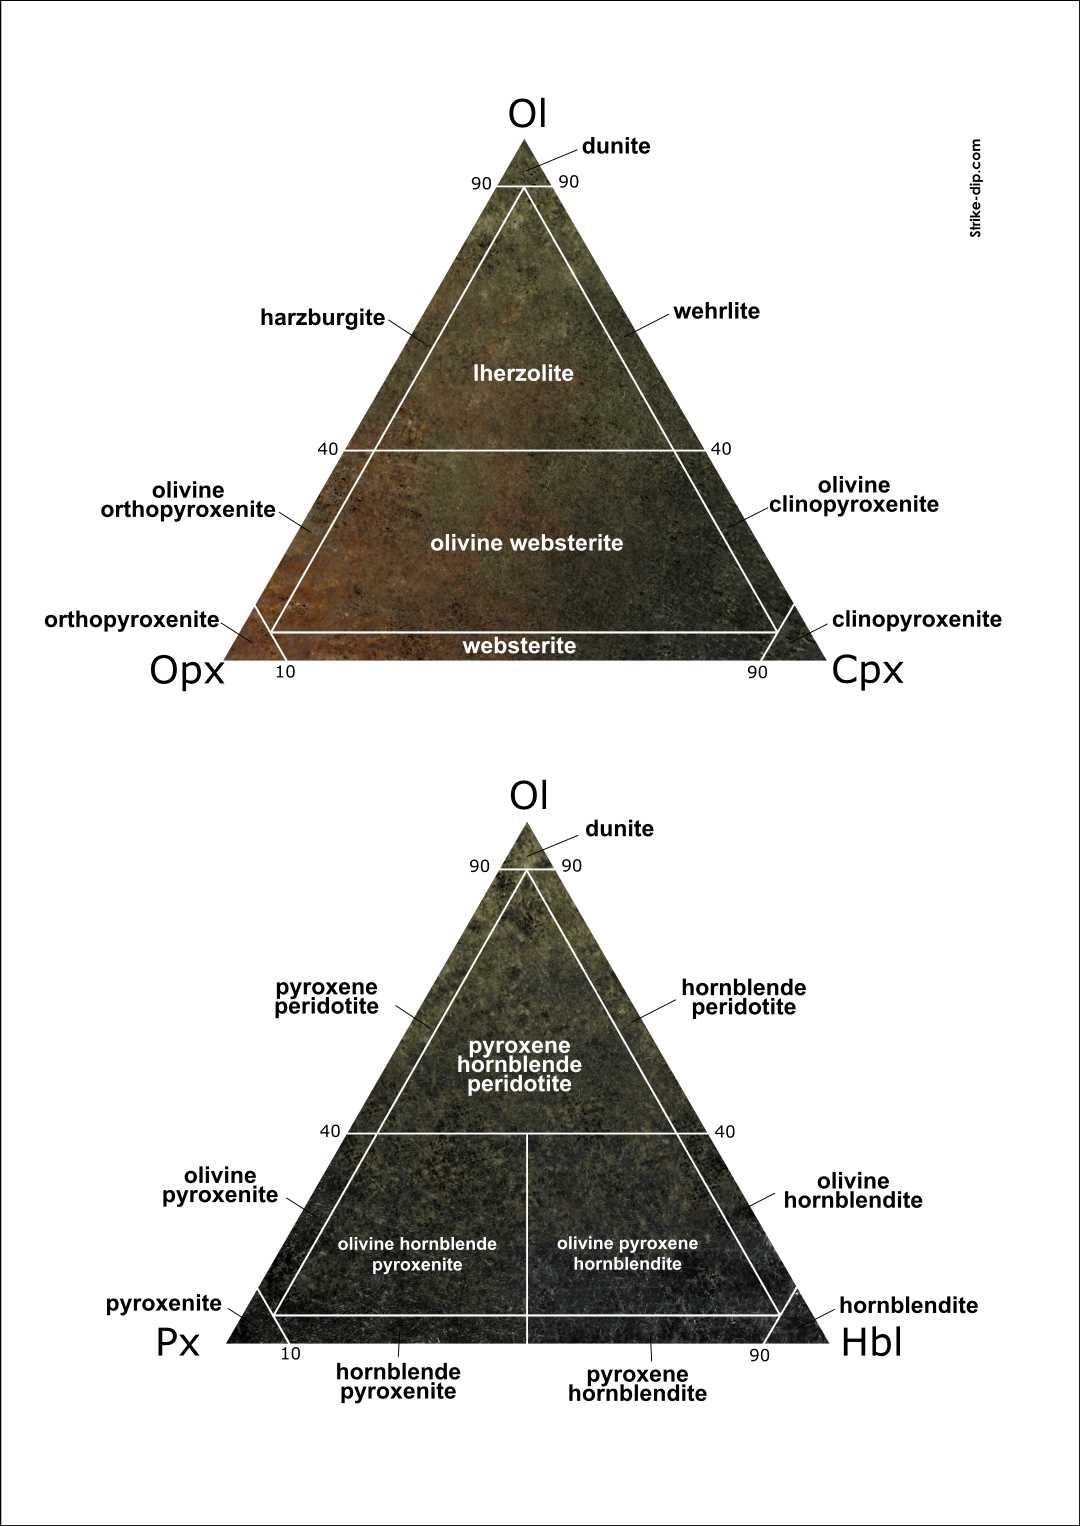
The ultramafic ternary diagram is based on the triangular diagram, which is commonly used in petrology to classify rocks based on their mineral compositions. The triangular diagram is divided into three corners or vertices, each representing a major component: olivine, orthopyroxene, and clinopyroxene. These minerals are characteristic of ultramafic rocks and are used to define the boundaries of the diagram.
By plotting the compositions of ultramafic rocks on the ternary diagram, geologists can gain insights into the origins and processes that have shaped these rocks. The positions of the data points on the diagram can indicate the degree of partial melting, the depth of crystallization, and the presence of certain mineral assemblages. This information can be used to infer the tectonic setting and geological history of the rocks.
The ultramafic ternary diagram is a valuable tool for both research and practical applications in the field of petrology. It allows scientists to classify and compare ultramafic rocks, providing a framework for understanding the complex processes that occur within the Earth’s mantle. By studying the compositions and relationships of ultramafic rocks, geologists can unravel the mysteries of our planet’s deep interior.
Ultramafic Ternary Diagram
An ultramafic ternary diagram is a graphical representation of the mineral composition of ultramafic rocks. Ultramafic rocks are igneous rocks that have a very high percentage of mafic minerals, such as olivine and pyroxene. The ternary diagram allows geologists to easily classify and identify these rocks based on their mineral composition.
The ultramafic ternary diagram is based on the concept of mineral proportions. It consists of a triangular chart where three mineral components are represented at each of the three vertices. The most commonly used minerals in the diagram are olivine, orthopyroxene, and clinopyroxene. Other minerals may also be included depending on the specific application.
The positions of different ultramafic rock samples on the ternary diagram represent their mineral composition. Each point on the diagram corresponds to a unique combination of mineral proportions. By plotting the mineral proportions of a rock sample and locating it on the diagram, geologists can determine its overall mineral composition and classify it accordingly.
The ultramafic ternary diagram is a useful tool in petrology and geology for rock classification, as well as for understanding the petrogenesis and evolution of ultramafic rocks. It provides a visual representation of the mineral proportions and allows for easy comparison and identification of different rock samples. This diagram is widely used in research, exploration, and mining to aid in the characterization and interpretation of ultramafic rocks.
What is an Ultramafic Ternary Diagram?

An ultramafic ternary diagram is a graphical representation that allows geologists and petrologists to classify and understand the composition of ultramafic rocks. Ultramafic rocks are igneous rocks that are rich in magnesium and iron and contain little to no silica. They are typically associated with processes such as mantle melting, partial melting, and mantle metasomatism.
The diagram is based on a triangular diagram, where three components of the rock composition are represented on the vertices of the triangle. These components are usually olivine (Oliv), pyroxenes (Px), and amphiboles (Amph). Each point within the triangle represents a rock composition, and the position of the point within the triangle indicates the relative proportions of the three components.
The diagram is useful because it provides a visual representation of the rock compositions and allows geologists to compare different rocks and identify their origins. For example, rocks that plot near the olivine vertex are likely to have formed from mantle melting, while rocks that plot near the amphibole vertex may have undergone metasomatism or have a volcanic origin.
The ultramafic ternary diagram is an important tool in petrology and geology and is used in various studies, such as understanding mantle processes, interpreting the formation of igneous rocks, and studying the tectonic setting of different rock formations. It helps scientists classify and analyze ultramafic rocks, which can provide valuable insights into Earth’s geologic history and processes.
How is an Ultramafic Ternary Diagram Constructed?

An ultramafic ternary diagram is a graphical representation used in geology and petrology to classify and visualize the composition of ultramafic rocks, which are rich in magnesium and iron. It helps to identify the dominant mineral phases present in the rocks and provides insights into their petrogenesis and tectonic settings.
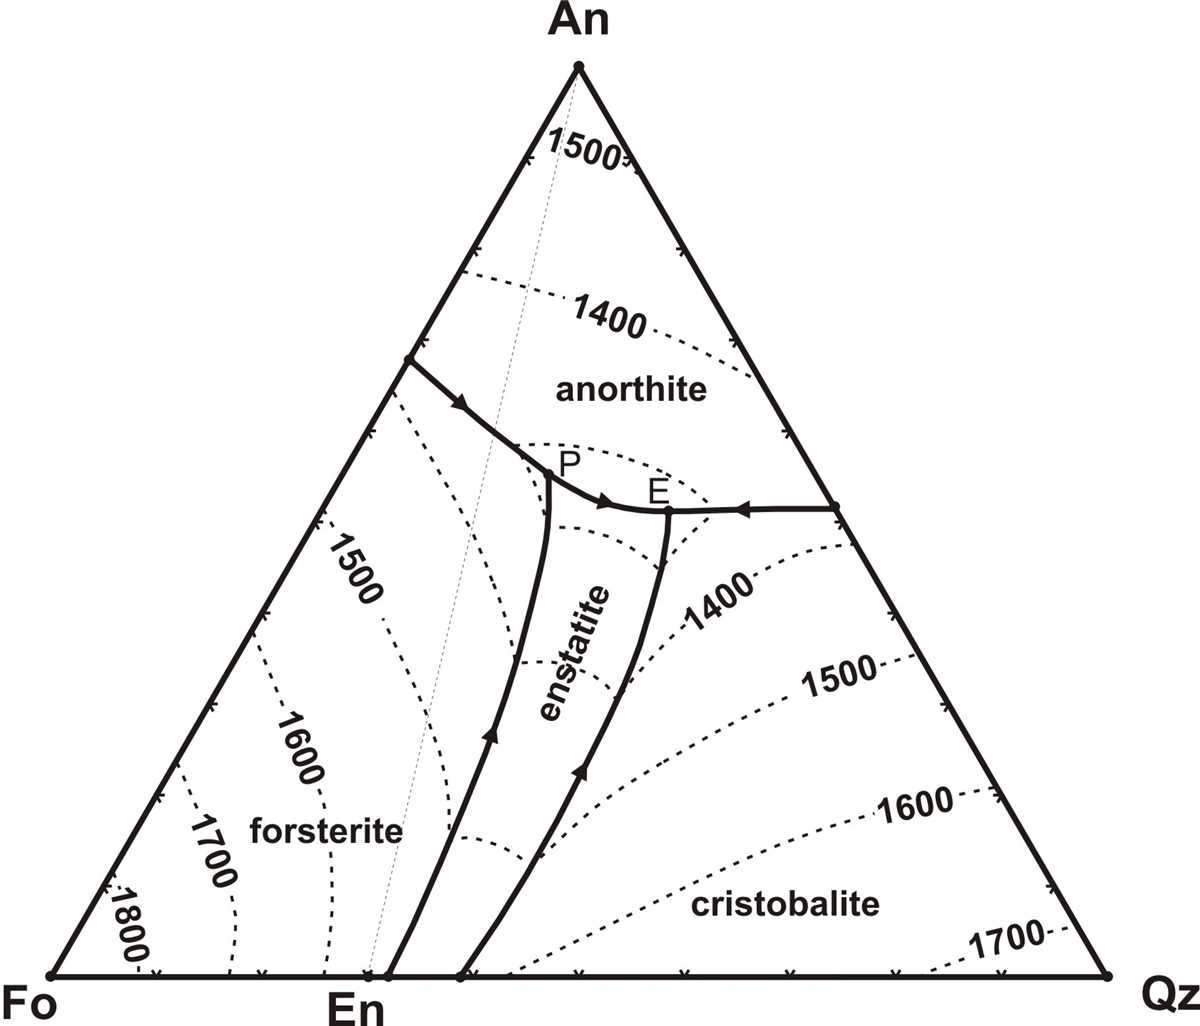
To construct an ultramafic ternary diagram, three key components are required: the chemical compositions of the rocks, an understanding of the mineral phase relationships, and knowledge of the ternary system being used. The most common ternary systems used in ultramafic petrology are the QAP (quartz, anorthite, and pyroxene) and QFM (quartz, forsterite, and magnetite) diagrams.
In the QAP diagram, the relative proportions of quartz, anorthite, and pyroxene are plotted on the three axes. The composition of each rock sample is determined by analyzing its major oxide constituents, such as SiO2, Al2O3, CaO, MgO, and FeO. These oxide values are then normalized to 100% and plotted on the diagram using appropriate scales.
The resulting plot of data points represents the composition of different ultramafic rocks. By analyzing the distribution of these points, geologists can infer the rock’s mineralogy and classify it accordingly. For example, a cluster of data points in the pyroxene-rich region would indicate the presence of pyroxene minerals, while a cluster in the anorthite-rich region would suggest the dominance of plagioclase feldspar.
In addition to identifying mineral phases, the ternary diagram can also provide information about the rock’s origin and tectonic history. Certain areas on the diagram correspond to specific tectonic settings, such as subduction zones, mid-ocean ridges, or continental rifts. By comparing the rock’s composition to known tectonic environments, geologists can make inferences about the geological processes that led to its formation.
In summary, an ultramafic ternary diagram is constructed by plotting the normalized chemical compositions of ultramafic rocks on a ternary system. This diagram allows geologists to identify mineral phases, classify rocks, and infer their tectonic origins. It is a valuable tool in the field of geology and petrology for understanding the composition and evolution of ultramafic rocks.
Applications of Ultramafic Ternary Diagrams
The ultramafic ternary diagram is a powerful tool used in petrology and geology to classify and analyze ultramafic rocks. These diagrams are often used to determine the mineral content and composition of rocks, providing valuable information about their origin and geological history.
One of the main applications of ultramafic ternary diagrams is in the field of igneous petrology. By plotting the mineral percentages of olivine, orthopyroxene, and clinopyroxene on a ternary diagram, geologists can determine the rock’s classification, such as peridotite or pyroxenite. This information can then be used to study the tectonic settings and geological processes that led to the formation of these rocks.
The ultramafic ternary diagram is also used in geochemical studies to determine the source of magmas. By analyzing the mineral compositions of ultramafic rocks and plotting them on a ternary diagram, geologists can infer the melting conditions and sources of these magmas. This information can provide insights into the Earth’s mantle dynamics and the processes that drive volcanic activity.
Furthermore, ultramafic ternary diagrams are employed in the field of ore geology. By studying the mineral composition and distribution of ultramafic rocks in specific geological settings, geologists can identify potential ore deposits. For example, certain ultramafic rocks known as komatiites are often associated with nickel and copper deposits. By using ternary diagrams, geologists can delineate the areas with the highest potential for mineral exploration.
In conclusion, ultramafic ternary diagrams have numerous applications in petrology and geology. They are utilized to classify rocks, determine magma sources, study mantle dynamics, and identify potential mineral deposits. These diagrams provide valuable insights into the composition and origin of ultramafic rocks, contributing to our understanding of geological processes and Earth’s history.
Interpreting Ultramafic Ternary Diagrams

One of the key uses of ultramafic ternary diagrams is to determine the degree of partial melting that a rock has undergone. For example, if a point falls on the olivine-rich end of the diagram, it suggests a higher degree of partial melting, as olivine is more readily produced during melting processes. On the other hand, if a point falls on the clinopyroxene-rich end, it indicates a lower degree of partial melting, as clinopyroxene is less likely to be produced during melting.
Another important application of ultramafic ternary diagrams is in characterizing the tectonic setting of ultramafic rocks. Different tectonic environments, such as subduction zones or continental rifts, can exhibit distinct patterns on the diagram. By comparing the position of a point with reference to established field boundaries, geologists can make inferences about the geodynamic processes that have shaped the rock. For example, a point within the subduction zone field suggests that the rock formed in a subduction zone setting, whereas a point within the rift field indicates continental rifting.
- In summary, ultramafic ternary diagrams are powerful tools for interpreting the mineral compositions of ultramafic rocks.
- They can provide insights into the degree of partial melting and the tectonic setting of these rocks.
- By analyzing the position of a point within the diagram, geologists can draw conclusions about the rock’s petrogenesis and tectonic history.
- These diagrams enable researchers to classify and compare ultramafic rocks, ultimately contributing to our understanding of Earth’s geology.
Limitations of Ultramafic Ternary Diagrams

While ultramafic ternary diagrams are a useful tool for visualizing and interpreting geochemical data, they do have some limitations that need to be considered. These limitations include:
- Simplification: Ultramafic ternary diagrams simplify complex geological processes into a two-dimensional representation, which may not fully capture the complexities of the actual system. They provide a simplified view of the relationships between major rock-forming minerals and may not account for all the minor minerals present.
- Limited compositional range: Ultramafic ternary diagrams are designed specifically for ultramafic rocks, which have a high content of magnesium and iron. They may not be applicable or accurate for other rock types with different chemical compositions.
- Interpretation challenges: Interpreting ultramafic ternary diagrams requires a thorough understanding of the underlying geochemical processes and the limitations of the diagram itself. It is important to consider the potential effects of alteration, metamorphism, and other geological processes that can impact the geochemical signatures.
- Data limitations: The accuracy and precision of the data used to construct ultramafic ternary diagrams can influence their reliability and validity. Errors in measurements, sample contamination, and other factors can introduce uncertainties into the interpretation.
In conclusion, ultramafic ternary diagrams are a valuable tool for visualizing and interpreting geochemical data related to ultramafic rocks. However, it is essential to be aware of their limitations and to use them in conjunction with other analytical techniques and geological observations for a comprehensive understanding of the rock system.