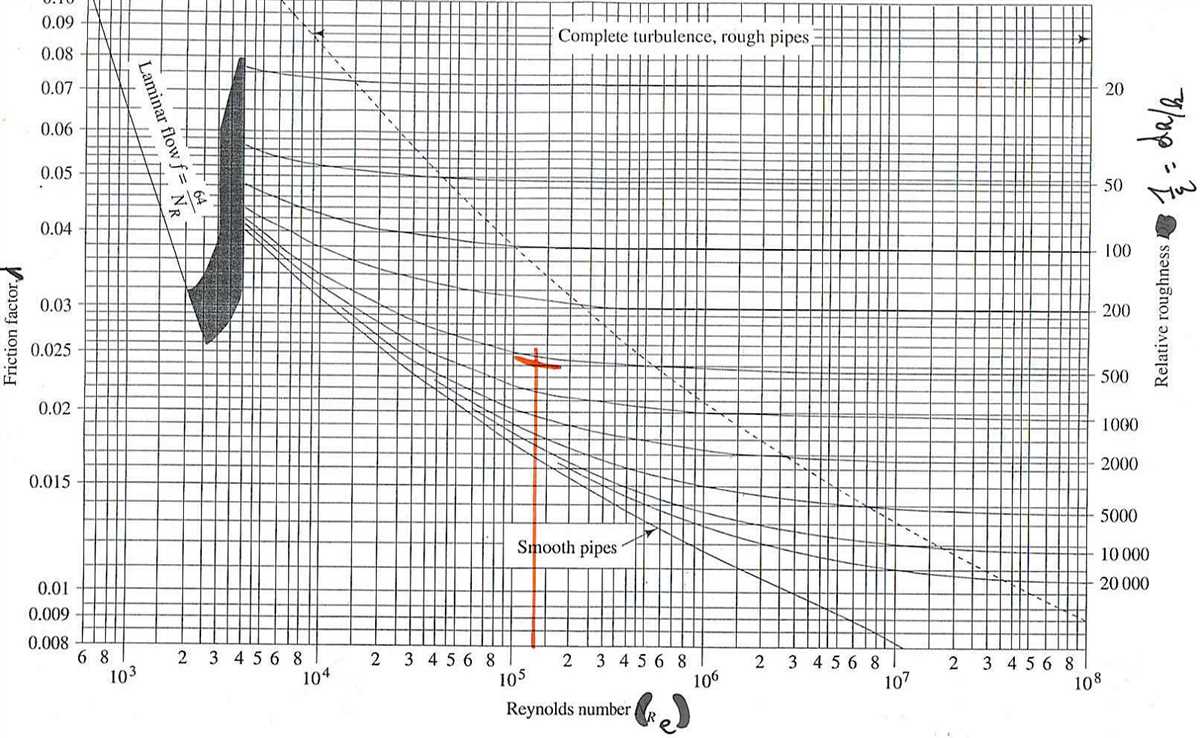
In the field of fluid mechanics, engineers and scientists often encounter the need to determine the flow characteristics of a fluid in a pipe. One important tool that aids in this task is the Moody diagram. The Moody diagram is a graphical representation of the friction factor, which is a parameter that quantifies the resistance to flow in a pipe.
The friction factor is a function of the Reynolds number and the relative roughness of the pipe. The Reynolds number is a dimensionless parameter that relates the inertial forces to the viscous forces in a fluid. It is defined as the product of the flow velocity, the characteristic length of the flow, and the fluid density divided by the fluid viscosity. The relative roughness is the ratio of the average height of the roughness elements on the pipe wall to the hydraulic diameter of the pipe.
The Moody diagram plots the friction factor on the y-axis and the Reynolds number on the x-axis. It provides a convenient way to determine the friction factor for a given value of the Reynolds number and relative roughness. The diagram is divided into two regions: the laminar flow region and the turbulent flow region. In the laminar flow region, the flow is smooth, and the friction factor is a function of the Reynolds number only. In the turbulent flow region, the flow is chaotic, and the friction factor is a function of both the Reynolds number and the relative roughness.
Understanding the Moody Diagram in Fluid Mechanics
The Moody diagram is a graphical representation of the friction factor in fluid flow through pipes. It is an essential tool in fluid mechanics, allowing engineers and researchers to determine the frictional losses in pipe systems and design efficient and cost-effective piping systems.
The Moody diagram plots the friction factor, denoted by f, against the Reynolds number and the relative roughness of the pipe wall. The Reynolds number is a dimensionless number that represents the ratio of the inertia forces to the viscous forces in the fluid flow. It is calculated using the pipe diameter, the fluid velocity, and the fluid properties.
The Moody diagram is divided into different regions, corresponding to different flow regimes. At low Reynolds numbers, the flow is laminar, and the friction factor can be calculated using the Hagen-Poiseuille equation. In this regime, the friction factor is relatively constant and is inversely proportional to the Reynolds number.
At higher Reynolds numbers, the flow transitions into the turbulent regime, where the friction factor is a complex function of the Reynolds number and the relative roughness of the pipe. The Moody diagram provides a convenient way to determine the friction factor in this regime by interpolating between the available data points. It is important to note that the friction factor in turbulent flow is higher than in laminar flow, resulting in increased pressure drop and energy loss.
The Moody diagram is widely used in various industries, including chemical, petroleum, and civil engineering, to design and analyze pipe systems. By selecting an appropriate pipe diameter and determining the friction factor, engineers can optimize the design of the system, minimize energy losses, and ensure efficient fluid flow.
What is the Moody Diagram?
The Moody Diagram, also known as the Moody chart or Moody’s diagram, is a graphical representation of the Darcy-Weisbach equation, which is used to calculate the head loss (pressure drop) in a pipe or duct system flowing with a fluid. It was developed by Lewis F. Moody and published in 1944.
The Moody Diagram is a plot of the friction factor (f) against the Reynolds number (Re) for a specific flow regime, which is determined by the pipe roughness and the fluid properties. The friction factor is a dimensionless quantity that accounts for the resistance to flow in a pipe, and the Reynolds number is a dimensionless parameter that describes the flow regime (laminar or turbulent) based on the ratio of inertia forces to viscous forces.
The Moody Diagram is a widely used tool in fluid mechanics and is particularly useful in the design and analysis of pipe systems. By using the Moody Diagram, engineers can determine the friction factor for a given Reynolds number and pipe roughness, and then use this information to calculate the head loss and pressure drop in the system. This in turn allows for the optimization of pipe sizes, pump selections, and overall system performance.
In summary, the Moody Diagram is a graphical representation of the Darcy-Weisbach equation, and it provides a convenient way to determine the friction factor for a given Reynolds number and pipe roughness. It is an essential tool in fluid mechanics for analyzing and designing pipe systems.
Importance of the Moody Diagram in Fluid Mechanics
The Moody diagram is an essential tool used in fluid mechanics to determine the friction factor, also known as the Darcy-Weisbach friction factor, which is crucial in various engineering calculations. The diagram provides a graphical representation of the complex relationship between the Reynolds number, a dimensionless parameter that characterizes the flow regime, and the friction factor. The Reynolds number takes into account the fluid’s velocity, density, viscosity, and characteristic length scale.
The friction factor is a crucial parameter in pressure drop calculations in pipelines, channels, and other flow systems. It determines the amount of energy loss due to the fluid’s resistance to flow, which directly affects the required pump power or the pressure drop along the system. By using the Moody diagram, engineers can quickly and accurately determine the friction factor for different flow conditions, saving time and effort compared to tedious calculations using empirical equations or iterative methods.
The Moody diagram simplifies the process of finding the friction factor by presenting a comprehensive set of data in a single graph, allowing engineers to interpolate or extrapolate values to match specific flow conditions. It incorporates data from both laminar and turbulent flow regimes and takes into account the roughness of the pipe’s inner surface, which has a significant impact on the friction factor. Engineers can simply identify the Reynolds number and the relative roughness of the pipe, and then read off the corresponding friction factor from the Moody diagram.
The Moody diagram is widely used in a range of industries and applications, including chemical engineering, civil engineering, and mechanical engineering. It provides a convenient and reliable method for calculating pressure drops and determining the required pump power in various flow systems. The accuracy and simplicity of the Moody diagram make it a valuable tool for engineers in fluid mechanics, helping them optimize designs, evaluate performance, and ensure the efficient operation of fluid systems.
Construction and Structure of the Moody Diagram
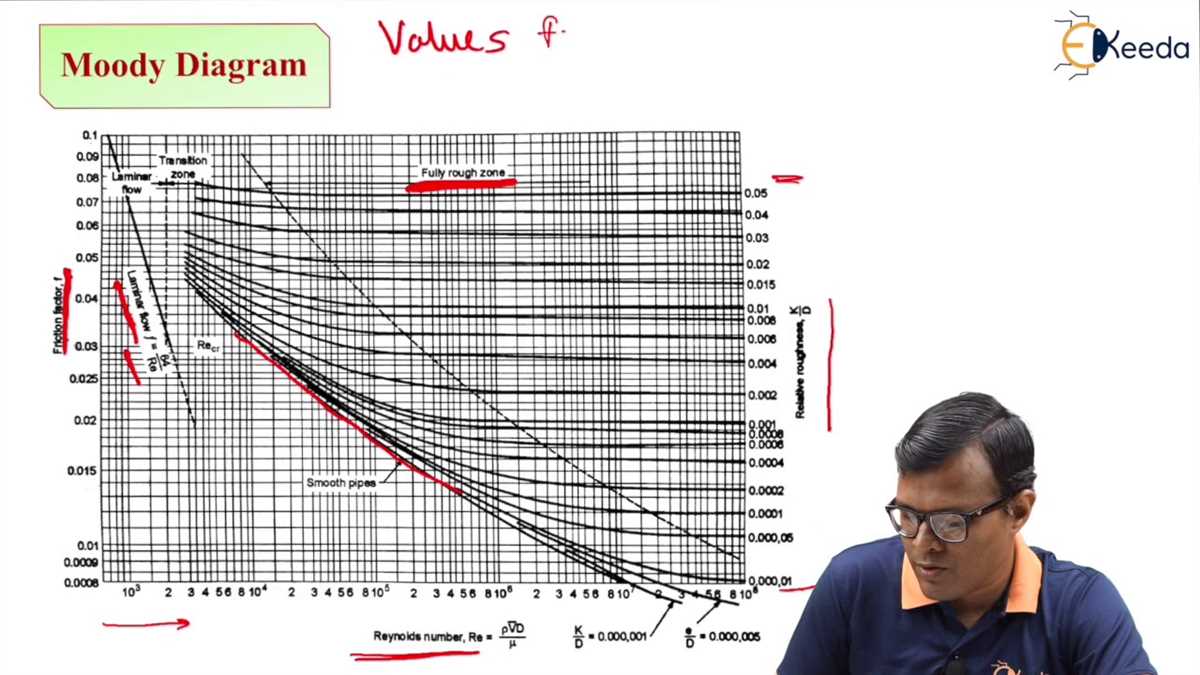
The Moody diagram, named after Lewis F. Moody, is a graph that represents the relationship between the Reynolds number and the friction factor in fluid flow. It is widely used in fluid mechanics to determine the flow characteristics of pipes and ducts. The construction of the Moody diagram involves plotting experimental data obtained from empirical correlations and equations.
The structure of the Moody diagram is divided into several regions, each representing a different flow regime. The diagram consists of a logarithmic scale plot of the friction factor (f) on the y-axis and the Reynolds number (Re) on the x-axis. The regions on the diagram include laminar flow, transition flow, and turbulent flow. In each region, the friction factor is represented by a different equation or correlation.
The laminar flow region, which occurs at low Reynolds numbers, is characterized by a smooth flow of fluid with distinct fluid layers. In this region, the friction factor can be calculated using the Hagen-Poiseuille equation. The transition flow region lies between laminar and turbulent flow and is characterized by an unstable flow pattern. In this region, the friction factor is difficult to predict accurately and is often determined through experimental data.
The turbulent flow region, which occurs at high Reynolds numbers, is characterized by chaotic fluid motion with a large mixing of fluid layers. In this region, the friction factor can be calculated using the Colebrook-White equation or other similar correlations. The Moody diagram provides a useful tool for engineers and researchers to analyze and predict the flow characteristics of pipes and ducts in various flow regimes.
Application of the Moody Diagram in Pipe Flow Calculations
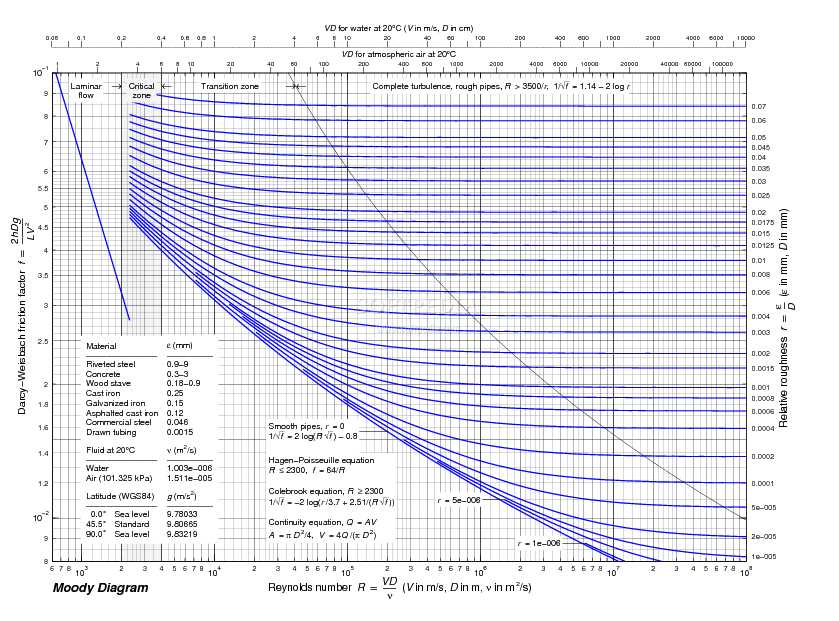
The Moody diagram is a graphical representation that shows the relationship between the Reynolds number, the relative roughness, and the friction factor in pipe flow calculations. It is a valuable tool used by engineers and researchers in fluid mechanics to determine the pressure drop and flow rate in pipes. By using the Moody diagram, engineers can efficiently analyze and design piping systems, ensuring optimal performance and minimizing energy losses.
One of the main applications of the Moody diagram is in determining the friction factor for different types of pipe flow, such as laminar flow, transitional flow, and turbulent flow. The friction factor is an important parameter used to calculate the pressure drop in a pipe due to the viscous effects of the fluid. By knowing the characteristics of the pipe, such as its roughness and diameter, and the fluid properties, such as density and viscosity, engineers can determine the appropriate friction factor from the Moody diagram and use it in pressure drop calculations.
The Moody diagram is also used in pipe flow calculations to determine the flow rate for a given pressure drop. By rearranging the Darcy-Weisbach equation, which relates the pressure drop, pipe length, pipe diameter, fluid density, and viscosity to the friction factor and flow rate, engineers can solve for the desired flow rate using the friction factor obtained from the Moody diagram. This allows engineers to accurately predict the flow rate and ensure that the pipe system meets the required specifications.
Interpreting the Moody Diagram for Different Flow Regimes
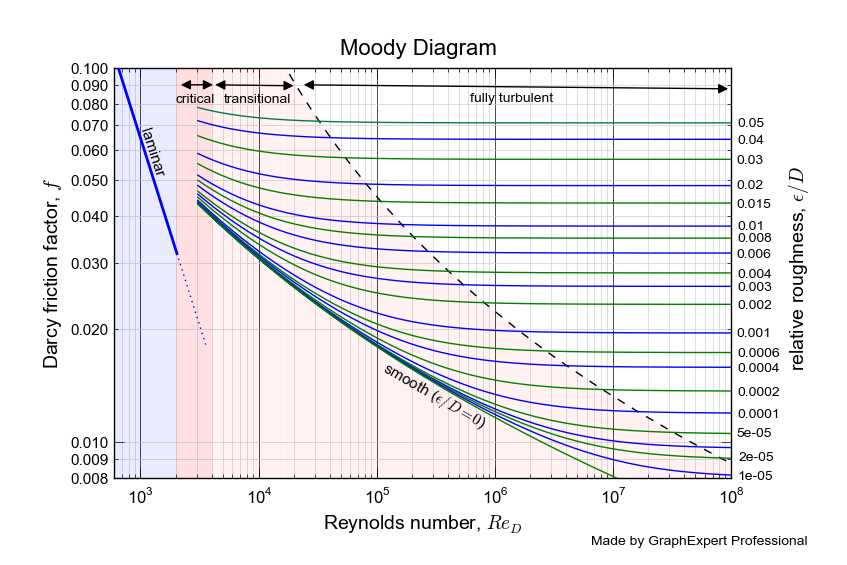
The Moody diagram is a graphical representation of the friction factor f (or the Darcy-Weisbach friction factor) against the Reynolds number (Re) and the relative roughness (ε/D) in pipe flow. It is widely used in fluid mechanics to determine the flow regime and estimate the pressure drop in pipes. By interpreting the Moody diagram, engineers and researchers can understand the characteristics of different flow regimes and make informed decisions for the design and analysis of pipe systems.
For laminar flow, which occurs at low Reynolds numbers (Re < 2000), the Moody diagram shows a straight line with a constant friction factor of 16/Re. This indicates that in laminar flow, the frictional losses are proportional to the inverse of the Reynolds number. Laminar flow is characterized by smooth and orderly movement of fluid particles, with minimal mixing and turbulence. In this regime, pressure drop is primarily determined by viscous forces.
As the Reynolds number increases, the flow transitions to the turbulent regime. The Moody diagram represents this transition with a curved line, known as the transition region. In this region, the friction factor varies depending on the Reynolds number and the relative roughness. This is because in turbulent flow, eddies and vortices form, resulting in increased mixing and momentum exchange between fluid layers. The turbulent flow regime is further classified into two regions: rough and smooth.
In the rough region, characterized by a relative roughness (ε/D) greater than 0.05, the friction factor remains relatively constant at higher Reynolds numbers. This indicates that the wall roughness plays a significant role in determining the pressure drop. As the relative roughness increases, the friction factor also increases, leading to higher pressure losses. In contrast, in the smooth region, characterized by a relative roughness less than 0.05, the friction factor decreases with increasing Reynolds number. This is because the effect of wall roughness becomes less prominent compared to the turbulent flow itself. In this region, the pressure drop is primarily governed by inertial forces.
In conclusion, the Moody diagram provides a comprehensive means to interpret the flow regimes in pipe flow. By understanding the different regions of the Moody diagram, engineers can accurately estimate the pressure drop and select appropriate pipe sizes and roughness factors for efficient and cost-effective design of fluid systems.
Limitations and Criticisms of the Moody Diagram

The Moody diagram is a widely used tool in fluid mechanics for estimating friction factor in pipes. It provides a graphical representation of the Colebrook equation, which relates the friction factor to the Reynolds number and relative roughness of the pipe. While the Moody diagram is a valuable resource, it does have some limitations and criticisms that should be taken into account.
1. Limited Applicability:
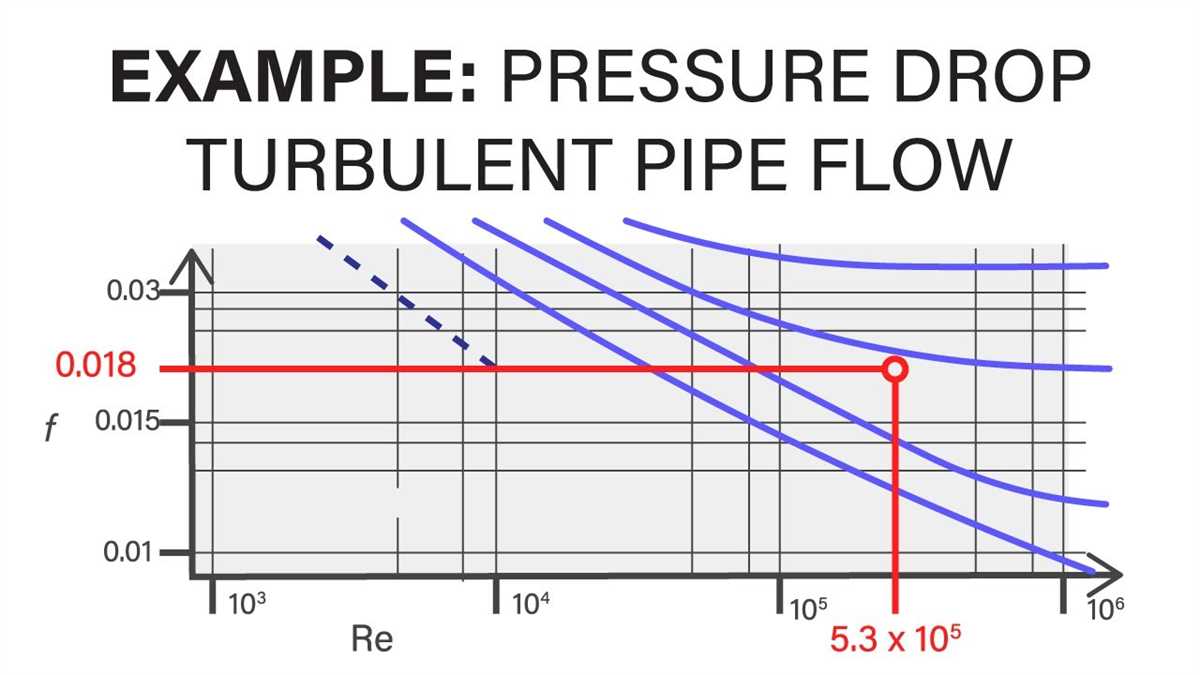
The Moody diagram is primarily applicable to fully developed, turbulent flow in smooth pipes. It may not accurately predict friction factor for laminar flow or for flow in rough pipes. In these cases, other equations or methods may be required to estimate friction factor. Additionally, the Moody diagram is not applicable to non-circular pipes or other non-standard geometries.
2. Simplified Assumptions:
The Moody diagram is based on a number of simplified assumptions, such as the assumption of fully developed flow and the neglect of secondary flow effects. These assumptions may introduce some error into the estimations obtained from the diagram. Furthermore, the Moody diagram assumes that the fluid is Newtonian and incompressible, which may not be valid for certain fluids or operating conditions.
3. Limited Range of Parameters:
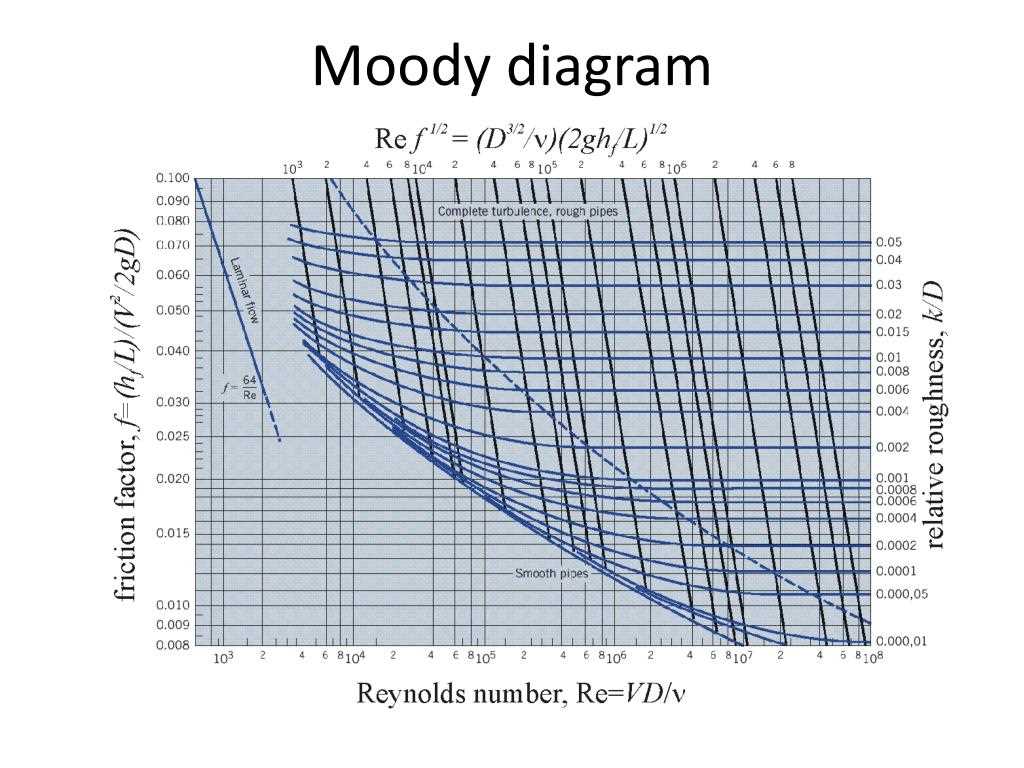
The Moody diagram is limited in its range of parameters, particularly in terms of pipe roughness and Reynolds number. For very rough pipes or very low Reynolds numbers, the diagram may not provide accurate results. In such cases, alternative methods, such as numerical simulations or experimental measurements, may be necessary.
Summary:
The Moody diagram is a useful tool for estimating friction factor in pipes, but it has certain limitations and criticisms that should be taken into account. Its applicability is limited to fully developed, turbulent flow in smooth pipes, while its assumptions and parameter range may introduce some error into the estimations. Despite these limitations, the Moody diagram remains a widely used and valuable resource in fluid mechanics.