
An Entity-Relationship (ER) diagram is a visual representation of the relationships between entities in a database. It is a useful tool for database designers and developers to understand the structure and relationships within a database. ER diagrams are commonly used in the initial stages of database design to illustrate the entities, attributes, and relationships that will be included in the database.
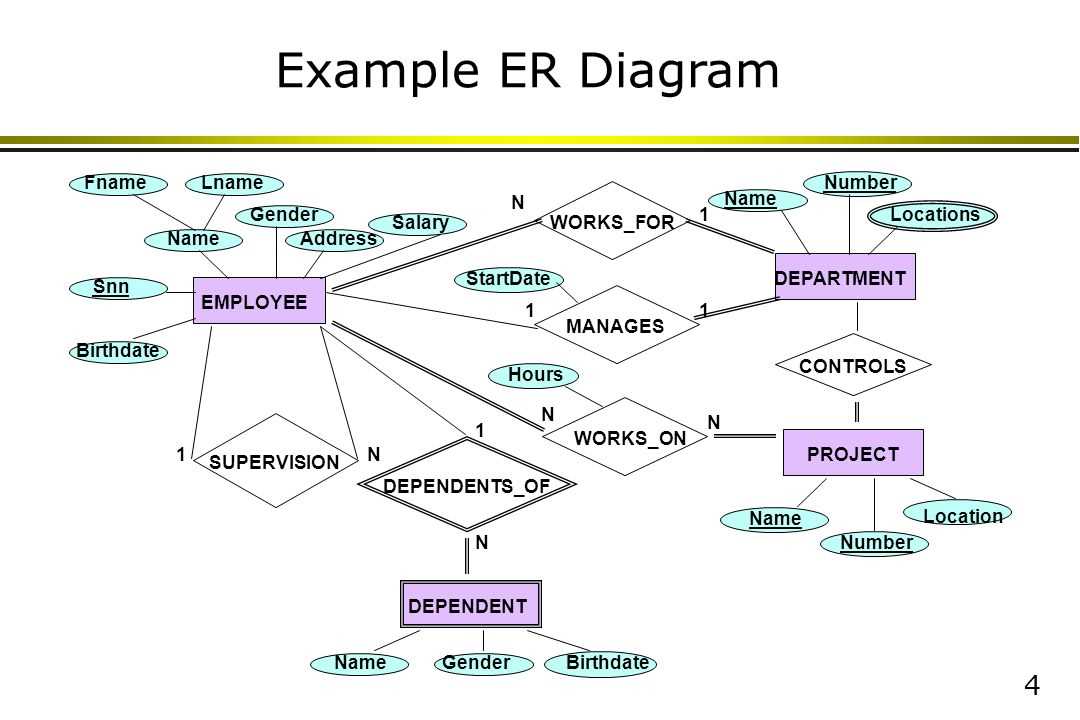
In an ER diagram, entities are represented as rectangles, attributes as ovals, and relationships as diamond shapes. The relationships between entities are represented by lines connecting the related entities. These relationships can be one-to-one, one-to-many, or many-to-many, and are labeled to indicate the cardinality of the relationship.
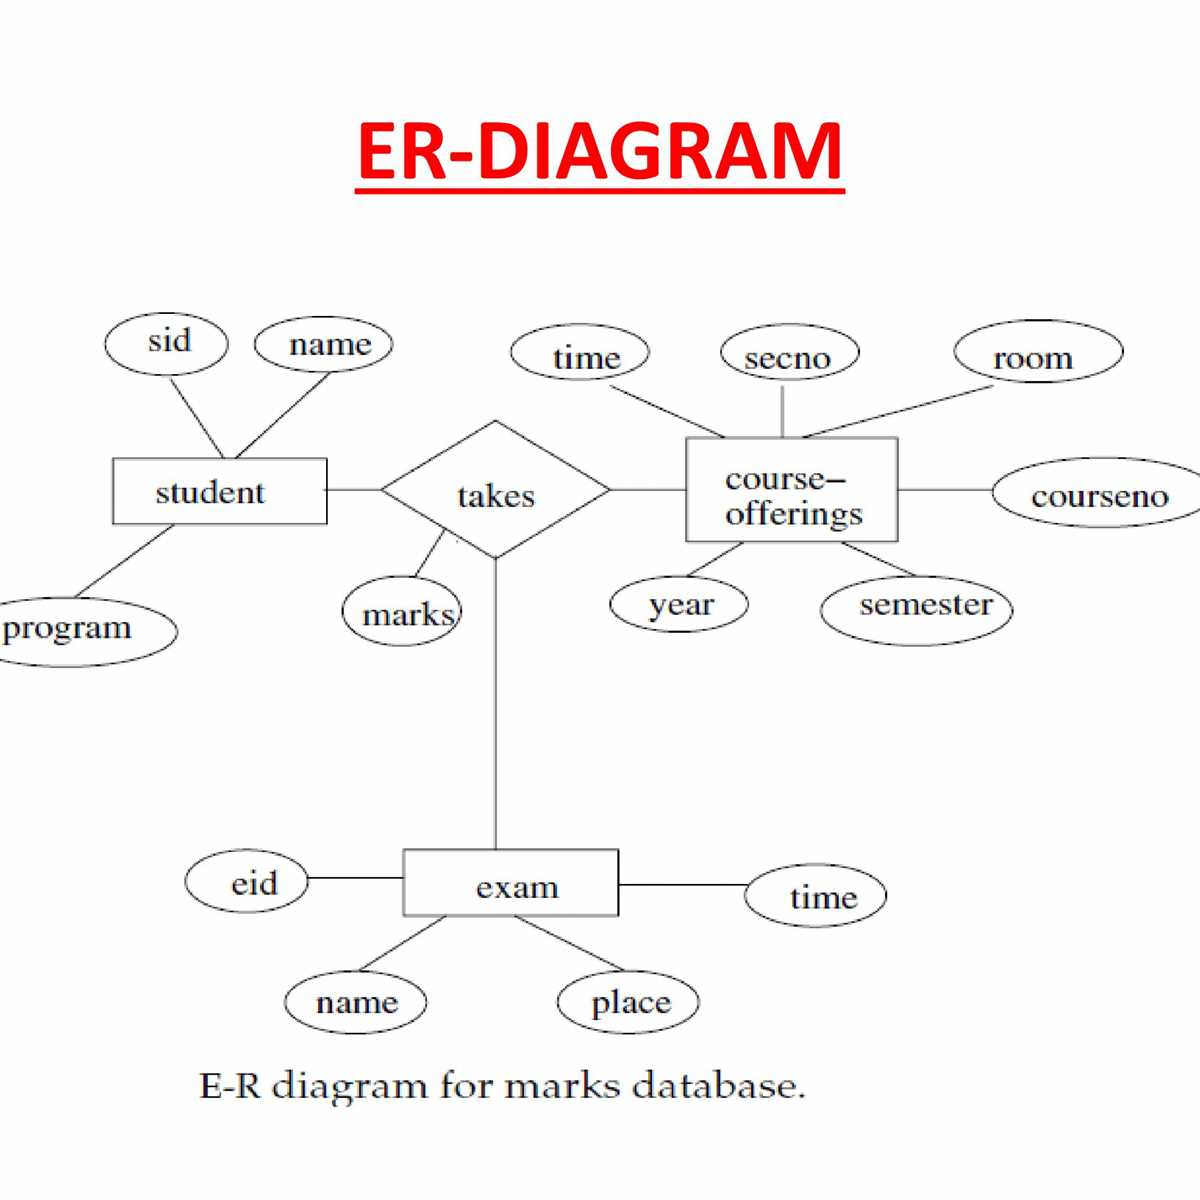
For example, let’s consider a simple ER diagram for a university database. The entities in this diagram may include students, courses, and instructors. The attributes for the student entity may include student ID, name, and major. The attributes for the course entity may include course ID, title, and department. The instructor entity may have attributes such as instructor ID and name.
Understanding ER Diagrams
An Entity-Relationship (ER) diagram is a visual representation of the relationships between the entities in a database. It is a powerful tool that helps to design and understand the structure of a database by showing the relationships between entities, their attributes, and the constraints that govern those relationships.
Entities: In an ER diagram, entities are represented by rectangles, and they represent the real-world objects or concepts that are stored in the database. For example, in a university database, entities can be students, instructors, courses, departments, etc.
Attributes: Attributes describe the characteristics or properties of entities. They are represented by oval shapes connected to the corresponding entity. For example, for a student entity, attributes can include name, ID, date of birth, etc.
Relationships: Relationships define how entities are connected to each other. They are represented by diamond shapes between the related entities. For example, the relationship between a student and a course can be represented as “enrolls in”. Relationships can have cardinality and participation constraints, which specify the number of instances of one entity that can be associated with the other entity.
Cardinality: Cardinality represents the number of occurrences of one entity that can be associated with another entity. It can be one-to-one, one-to-many, many-to-one, or many-to-many. For example, the cardinality between a student and a course can be one-to-many, indicating that a student can enroll in multiple courses.
Participation: Participation defines if every instance of one entity must be associated with an instance of another entity. It can be total participation or partial participation. For example, in a university database, the participation between a student and a course can be total, indicating that every student must be enrolled in at least one course.
Overall, ER diagrams provide a visual representation of the structure and relationships in a database, making it easier to understand and design complex databases. They are widely used in database modeling and are an essential tool for database administrators and developers.
What is an ER Diagram?
An ER (Entity-Relationship) diagram is a visual representation of the entities, relationships, and attributes within a database. It is used to model the structure and organization of the data, helping to simplify the understanding and design of complex databases.
The ER diagram consists of different elements, including entities, which represent real-world objects or concepts, and relationships, which describe the associations between these entities. Attributes, on the other hand, define the properties or characteristics of the entities. These elements are connected through lines or arrows, indicating the type of relationship or association between them.
One of the key advantages of using an ER diagram is its ability to depict the relationships between entities in a clear and organized manner. It allows database designers, developers, and stakeholders to visualize the data model and identify any issues or inconsistencies early in the design process.
ER diagrams are commonly used during the database design phase, as they help in creating a blueprint for the database structure. They can also be used to communicate and document complex database systems, making it easier for different stakeholders to understand and collaborate on the database design.
Overall, an ER diagram serves as a valuable tool in database development and management, providing a visual representation of the database structure and enabling effective communication and decision-making throughout the database lifecycle.
Components of an ER Diagram
An entity-relationship (ER) diagram is a graphical representation of the relationships between entities in a database. It is used to visualize the structure and organization of a database, showing how different entities are related to each other. ER diagrams consist of various components that help in representing the entities, attributes, and relationships in a clear and concise manner.
The main components of an ER diagram include:
- Entity: An entity represents a real-world object or concept, such as a person, place, or thing. It is depicted as a rectangular shape in an ER diagram and contains the entity name.
- Attribute: An attribute represents a characteristic or property of an entity. It provides additional information about the entity and is depicted as an oval shape connected to the entity rectangle. Attributes have their own names and data types.
- Relationship: A relationship represents an association between two or more entities. It shows how entities are connected or related to each other. Relationships have their own names and cardinalities, which indicate the number and type of entities involved in the relationship.
- Cardinality: Cardinality defines the number of occurrences or instances of one entity that are associated with the instances of another entity in a relationship. It indicates the minimum and maximum number of entities that can participate in a relationship.
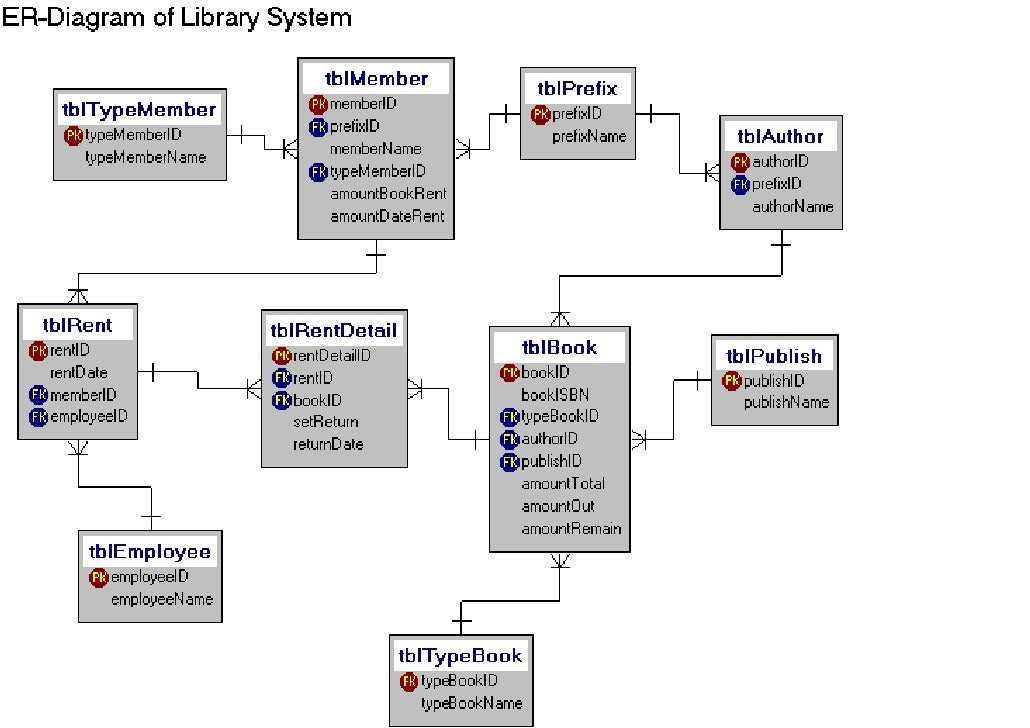
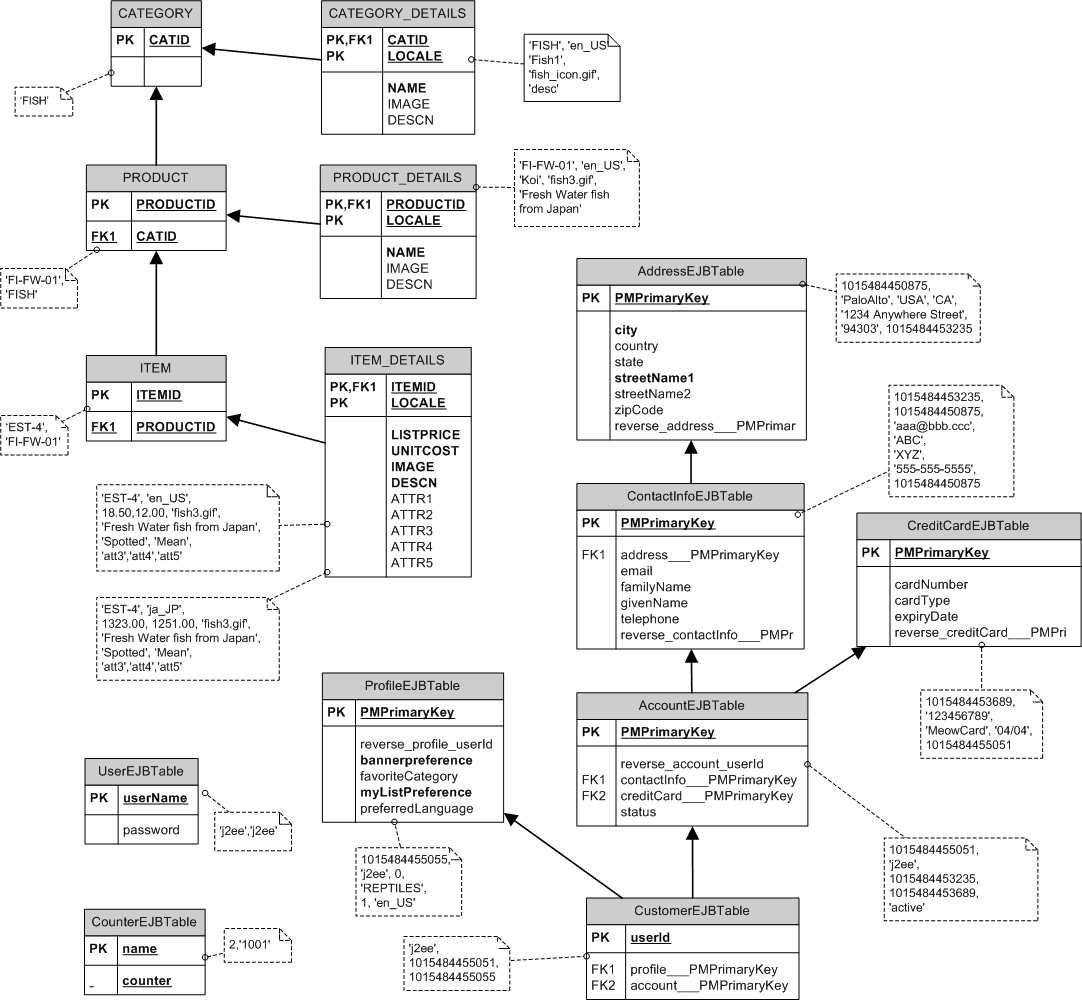
- Primary Key: A primary key is a unique identifier for an entity. It is a crucial component in a database, as it ensures the uniqueness and integrity of the data. In an ER diagram, the primary key is underlined or highlighted.
- Foreign Key: A foreign key is an attribute in one table that refers to the primary key of another table. It establishes a relationship between two tables and is used to maintain referential integrity.
By using these components, an ER diagram provides a visual representation of the database structure and helps in understanding and designing complex database systems. It serves as a powerful tool for database designers and developers to analyze and plan the data model before implementing it in a database management system.
Example of an ER Diagram
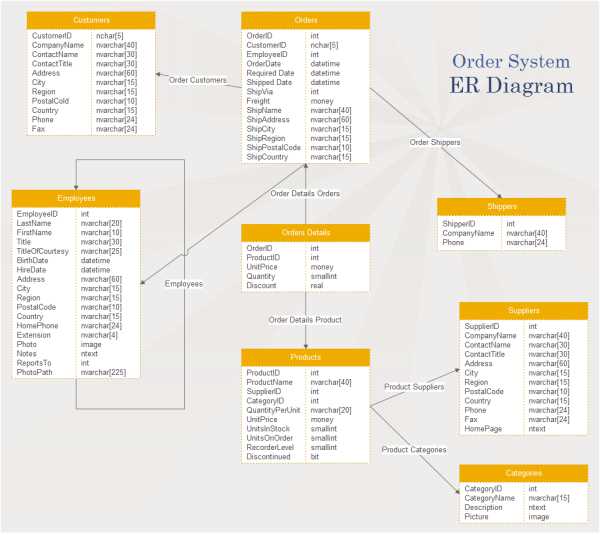
An ER diagram, also known as Entity-Relationship diagram, is a graphical representation of the entities and their relationships in a database. It is a visual tool used in database design to model the entities, attributes, and relationships between them. An ER diagram uses symbols to represent entities, attributes, and relationships, making it easier to understand the structure and organization of a database.
In an ER diagram, entities are represented as rectangles, attributes are represented as ovals, and relationships are represented as diamonds. The relationships between entities can be one-to-one, one-to-many, or many-to-many. The relationships can also have attributes that describe the relationship itself. For example, in a database for a university, the entity Student can have a one-to-many relationship with the entity Course, where a student can take multiple courses and a course can have multiple students. The relationship between Student and Course can have an attribute like “grade” to represent the grade the student received in that course.
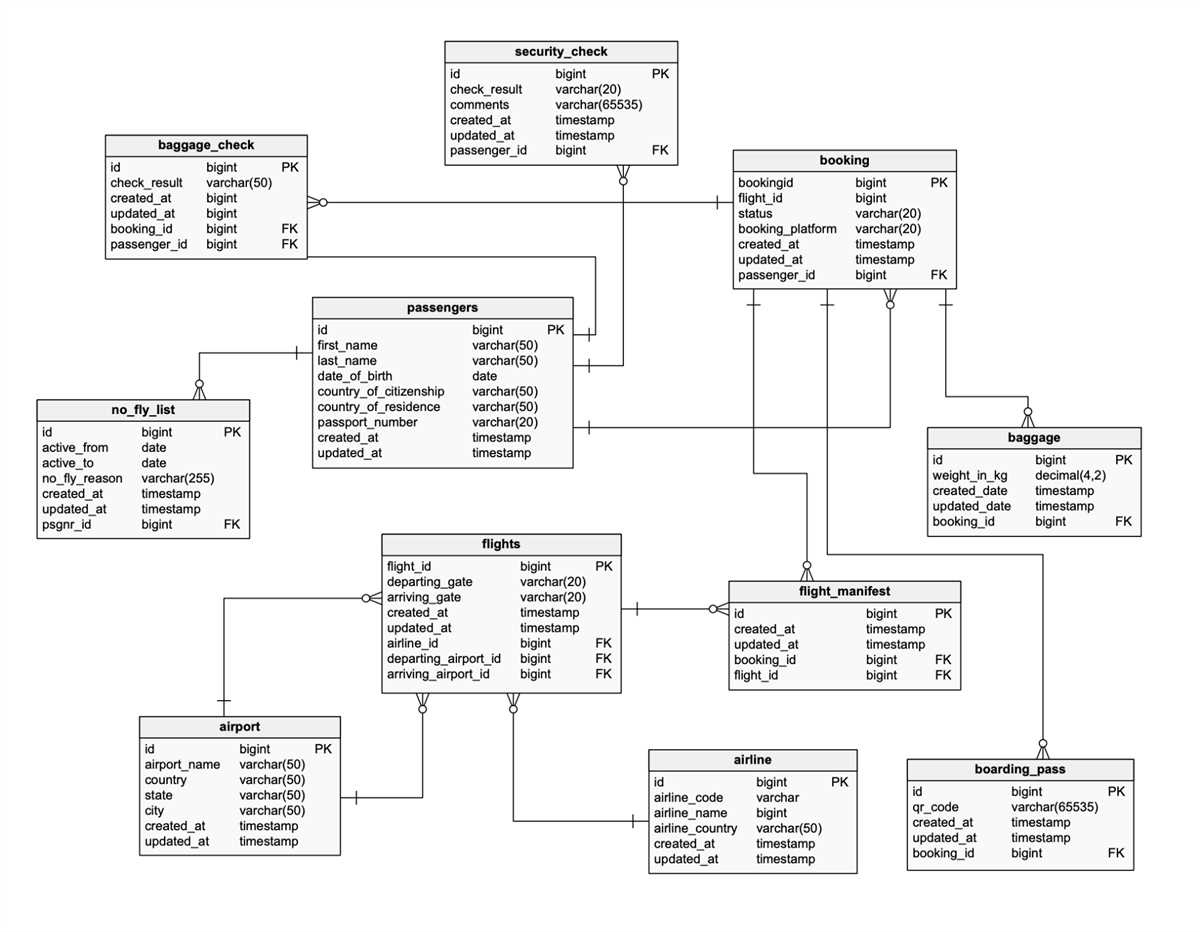
In addition to entities, attributes, and relationships, an ER diagram also includes cardinality constraints, which define the number of instances of one entity that can be associated with a single instance of another entity. These constraints are represented as lines with crow’s feet at the ends. For example, a one-to-many relationship between Student and Course would be represented by a line from Student to Course with a crow’s foot at the Course end, indicating that a student can be associated with multiple courses, but a course can only be associated with one student.
Overall, an ER diagram is a powerful tool for visualizing the structure and relationships of a database. It helps in the design and development of databases by providing a clear and concise representation of the entities, attributes, relationships, and constraints. It allows database designers to communicate and collaborate effectively, ensuring the accuracy and efficiency of the database design.
Benefits of an ER Diagram
An entity-relationship (ER) diagram is a powerful tool used in database design to visually represent the structure of a database. It offers numerous benefits that contribute to the efficiency and effectiveness of the design process.
1. Visual Representation: ER diagrams provide a clear and concise visual representation of the database structure. They use various symbols and lines to represent entities, relationships, and attributes, making it easier for stakeholders to understand and communicate the design.
2. Easy Understanding of Complex Systems: ER diagrams help in understanding even complex database systems by breaking them down into simple and understandable entities and relationships. The diagram allows stakeholders, including designers, developers, and end-users, to easily grasp the overall structure and relationships between different entities in the system.
3. Effective Communication Tool: ER diagrams act as an effective communication tool between stakeholders involved in the database design process. They help bridge the gap between technical and non-technical individuals by providing a visual representation that everyone can easily understand and discuss.
4. Database Design Validation: ER diagrams allow designers to validate and refine the initial database design by identifying and resolving any inconsistencies or errors in the entity relationships. This helps in creating a more accurate and robust database system.
5. Efficient Documentation: ER diagrams serve as an efficient documentation tool for databases. They provide a comprehensive overview of the database structure, entities, relationships, and attributes, which can be used for future reference, system documentation, and maintenance purposes.
6. Impact Analysis: With an ER diagram, developers can quickly analyze the potential impact of any changes or modifications to the database structure. They can easily identify the entities and relationships that might be affected, enabling them to plan and execute changes smoothly.
In conclusion, an ER diagram offers multiple benefits in the database design process. It provides a visual representation of database structure, facilitates easy understanding of complex systems, acts as an effective communication tool, helps validate the design, serves as efficient documentation, and enables impact analysis.
Best Practices for Creating ER Diagrams
ER diagrams are powerful tools for visualizing the structure and relationships of a database. However, creating an effective ER diagram requires careful planning and attention to detail. Here are some best practices to follow when creating ER diagrams:
1. Identify and understand the entities
Before creating an ER diagram, it is important to identify and understand the entities involved in the database. Entities represent real-world objects or concepts, and they form the building blocks of the ER diagram. Take the time to analyze the requirements and identify all relevant entities.
2. Determine relationships between entities
Once the entities have been identified, the next step is to determine the relationships between them. Relationships define how entities are associated with each other and play a crucial role in the structure of the ER diagram. Consider the cardinality and participation constraints when defining relationships.
3. Use clear and concise notation
When creating an ER diagram, it is important to use a clear and concise notation that is easily understandable. Stick to standard notation conventions, such as using rectangles for entities, diamonds for relationships, and lines with arrowheads to represent the directionality of relationships. Avoid overcrowding the diagram with unnecessary details.
4. Avoid redundant relationships
Redundant relationships can lead to confusion and complexity in the ER diagram. Avoid creating relationships that can be inferred from other relationships already present in the diagram. Instead, focus on capturing the essential relationships between entities.
5. Validate and refine the ER diagram
Once the initial ER diagram has been created, it is important to validate and refine it. Check for correctness, completeness, and clarity. Make sure that the diagram accurately represents the requirements and avoids any ambiguous or contradictory information. Refine the diagram based on feedback and input from stakeholders.
By following these best practices, you can create ER diagrams that effectively communicate the structure and relationships of your database.