
Lucidchart is a powerful online tool that allows you to create professional-quality ER (Entity-Relationship) diagrams. ER diagrams are essential for understanding and visualizing the relationships between entities in a database, making them an invaluable tool for database administrators, developers, and business analysts.
In this tutorial, we will walk you through the process of creating an ER diagram using Lucidchart. We will cover everything from creating entities and relationships to adding attributes and cardinality.
First, we will guide you through setting up your Lucidchart account and selecting the appropriate template for your ER diagram. Then, we will show you how to add entities to your diagram and define their attributes. Next, we will demonstrate how to establish relationships between entities and specify the cardinality of those relationships.
Lucidchart provides a user-friendly interface that makes it easy to drag and drop various shapes and connectors onto your diagram canvas. You can also customize the appearance of your ER diagram by adding colors, fonts, and line styles. When you are finished creating your diagram, you can easily export it in multiple formats, share it with colleagues, and collaborate in real-time.
Whether you are a beginner or an experienced user, this Lucidchart ER diagram tutorial will provide you with the knowledge and skills needed to create professional-level ER diagrams for your projects. So let’s get started and unlock the power of Lucidchart!
What is Lucidchart?
Lucidchart is a powerful online tool that allows users to create professional diagrams and flowcharts with ease. Whether you are working on a project, planning a process, or simply brainstorming ideas, Lucidchart provides a user-friendly interface and a wide range of features to help you visualize your concepts.
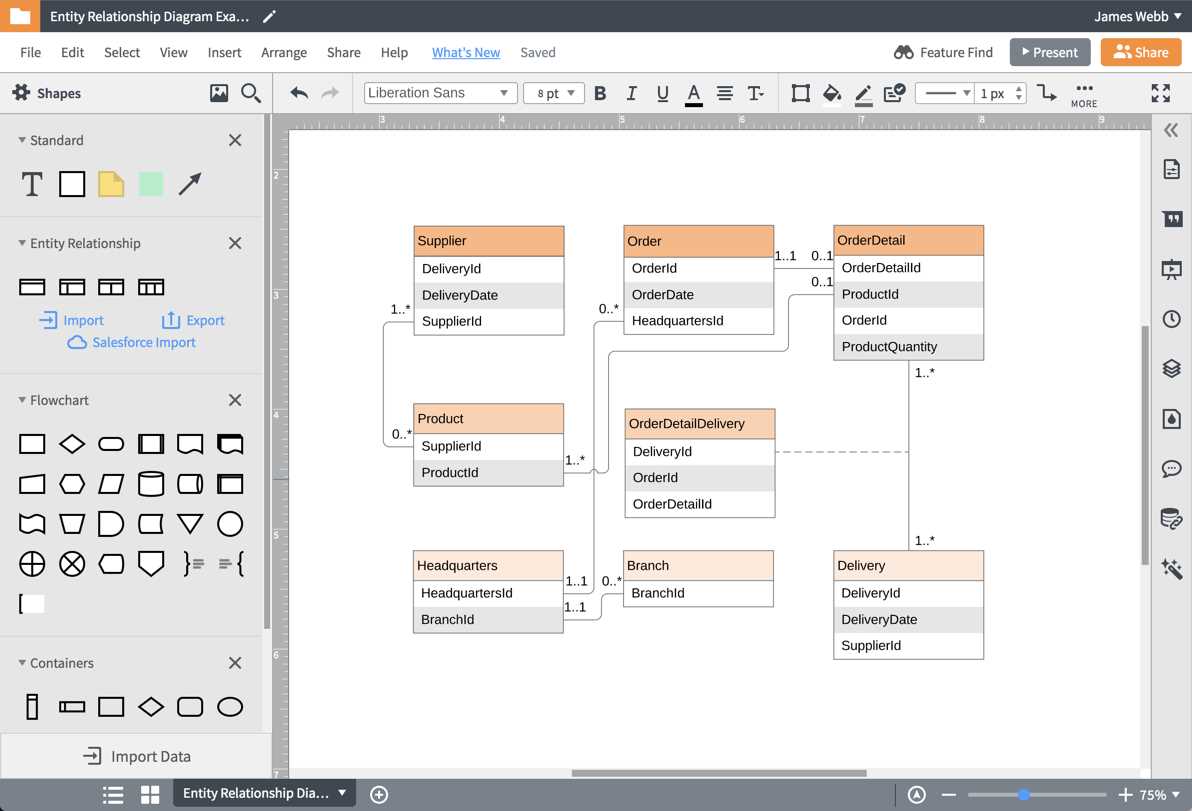
One of the key features of Lucidchart is its ability to create ER (Entity Relationship) diagrams. ER diagrams are essential in database design and help to illustrate the relationships between different entities and their attributes. With Lucidchart, you can easily drag and drop entities, add attributes, and connect them to create a clear and comprehensive ER diagram. This tool eliminates the need for manual drawing and allows for easy modifications and updates.
Lucidchart also provides a collaborative platform where multiple users can work on the same diagram in real-time. This allows for efficient team collaboration and eliminates the need for constant back-and-forth communication. Users can easily share their diagrams with others, leave comments and suggestions, and even track the changes made by each team member.
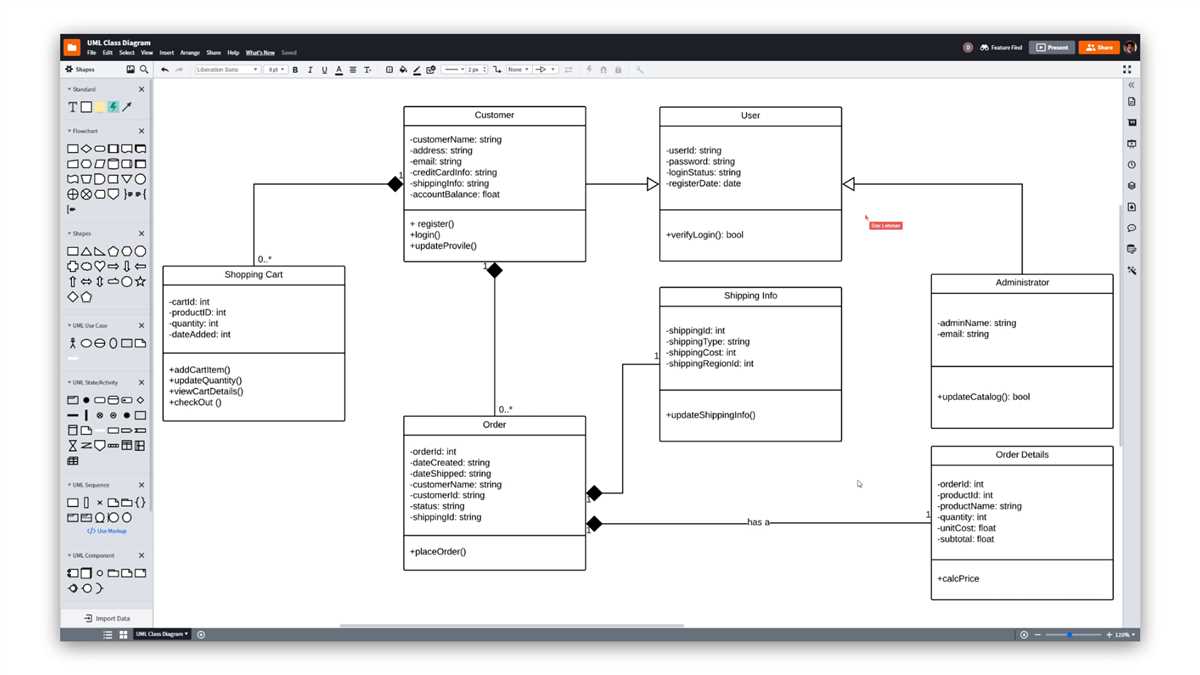
In addition to ER diagrams, Lucidchart offers a wide range of other diagram types, including flowcharts, mind maps, network diagrams, and more. The tool is compatible with various platforms and devices, making it accessible and convenient for users on different operating systems. Overall, Lucidchart is a versatile and user-friendly tool that simplifies the process of creating professional diagrams and fosters efficient collaboration.
Why use Lucidchart for ER diagrams?
Lucidchart is a powerful tool that offers several advantages for creating ER diagrams. With its intuitive interface and extensive range of features, it allows users to easily design and communicate complex data models. Here are some of the reasons why Lucidchart is the preferred choice for creating ER diagrams:
- User-friendly interface: Lucidchart provides a user-friendly interface that makes it easy for both beginners and experienced users to create ER diagrams. Its drag-and-drop functionality enables users to quickly add and connect entities, attributes, and relationships.
- Collaboration: Lucidchart offers real-time collaboration features that allow multiple users to work on the same diagram simultaneously. This makes it ideal for team projects, as team members can work together, make changes, and provide feedback in real-time.
- Extensive template library: Lucidchart provides a wide range of pre-designed templates for ER diagrams. These templates can be customized to suit specific needs, saving users time and effort in creating diagrams from scratch.
- Integration with other tools: Lucidchart seamlessly integrates with popular productivity tools like Google Drive, G Suite, Microsoft Office, and more. This allows users to easily import data from other applications, collaborate with team members, and export diagrams in various formats.
- Real-time updates and version control: Lucidchart automatically saves changes made to a diagram and allows users to access the revision history. This ensures that users can easily go back to previous versions, compare changes, and collaborate efficiently.
Overall, Lucidchart offers a comprehensive set of features and a user-friendly interface that makes it an ideal choice for creating ER diagrams. Its collaboration capabilities, extensive template library, and integration with other tools make it a valuable tool for both individuals and teams working on data modeling and database design projects.
Intuitive interface
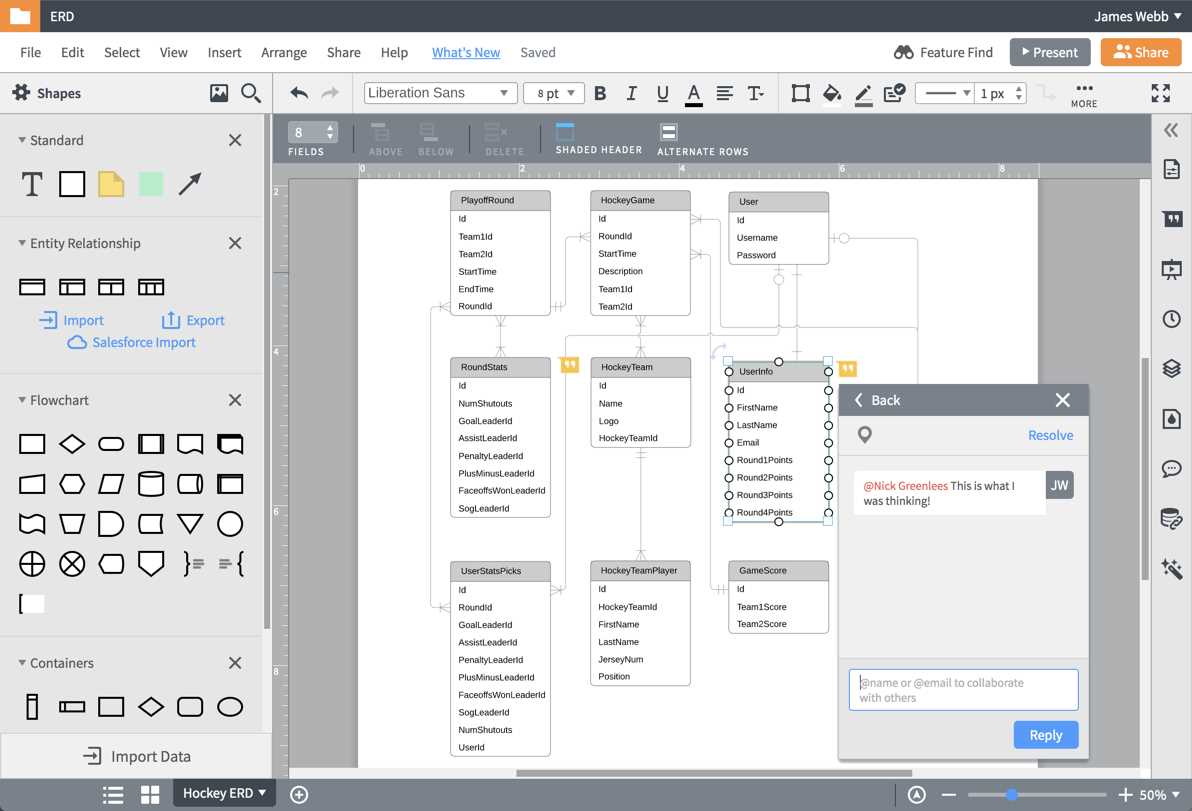
Lucidchart’s ER diagram tool provides users with an intuitive interface that makes it easy to create and edit entity-relationship diagrams. The interface is designed to be user-friendly, allowing even beginners to quickly get started with creating ER diagrams.
The tool offers a drag-and-drop functionality that simplifies the process of adding entities, attributes, and relationships to the diagram. Users can simply select the desired shape from the sidebar, drag it onto the canvas, and position it as needed. This allows for effortless creation and organization of entities and their relationships.
Additionally, the interface provides a range of customizable options to enhance the visual representation of the ER diagram. Users can adjust the size, color, and style of the entities and relationships, as well as add text labels and annotations for clarity. These customization features ensure that the diagram is not only functional but also visually appealing.
The intuitive interface of Lucidchart’s ER diagram tool makes it a powerful choice for professionals and students alike, as it allows for efficient creation and collaboration on complex database schemas. Whether you are designing a new database or analyzing an existing one, Lucidchart provides a user-friendly environment to visualize and understand the relationships between entities.
Collaboration features
Lucidchart provides various collaboration features that allow multiple users to work together on creating, editing, and reviewing ER diagrams. These features enable real-time collaboration and streamline the process of designing a database.
1. Real-time Editing: Lucidchart allows multiple users to work on the same ER diagram simultaneously. This means that changes made by one user are instantly reflected for all others, ensuring everyone is always on the same page. This real-time editing feature promotes efficient collaboration and reduces version control issues.
2. Comments and Feedback: Lucidchart provides the ability to add comments and feedback directly on the ER diagram. Users can leave comments to ask questions, provide suggestions, or clarify specific elements of the diagram. This feature enhances communication between team members and encourages collaboration.
3. Version History: Lucidchart automatically saves every version of an ER diagram, allowing users to easily track changes and revert to previous versions if necessary. This functionality ensures that all modifications are recorded and provides a safety net in case of accidental deletions or unwanted changes.
4. Sharing and Permissions: Lucidchart allows users to share their ER diagrams with others by providing them with viewing or editing permissions. This enables project managers to control who has access to the diagram and what actions they can perform. With customizable sharing and permissions settings, collaboration can be tailored to specific needs and requirements.
5. Integration with Other Tools: Lucidchart integrates with popular project management and collaboration tools, such as Jira, Confluence, and Slack. This integration allows users to seamlessly incorporate ER diagrams into their existing workflows, making it easier to collaborate and share information across different platforms.
How to create an ER diagram in Lucidchart
An ER (Entity-Relationship) diagram is a visual representation of the relationships between various entities in a database. Lucidchart is a popular online diagramming tool that enables users to create professional-looking ER diagrams easily. Here are the steps to create an ER diagram in Lucidchart:
Step 1: Create a new document
To start creating an ER diagram, log in to your Lucidchart account and create a new document. Choose the “ERD” template or select a blank template if you want to create the diagram from scratch.
Step 2: Add and label entities
Next, add the entities that you want to include in your ER diagram. Each entity represents a distinct object or concept in your database. Use the rectangle shape tool to draw the entities, and label them appropriately.
Step 3: Define attributes for each entity
Once you have added the entities, you can define the attributes associated with each entity. Attributes are the properties or characteristics of each entity. Use the text tool to add the attribute names inside the entities.
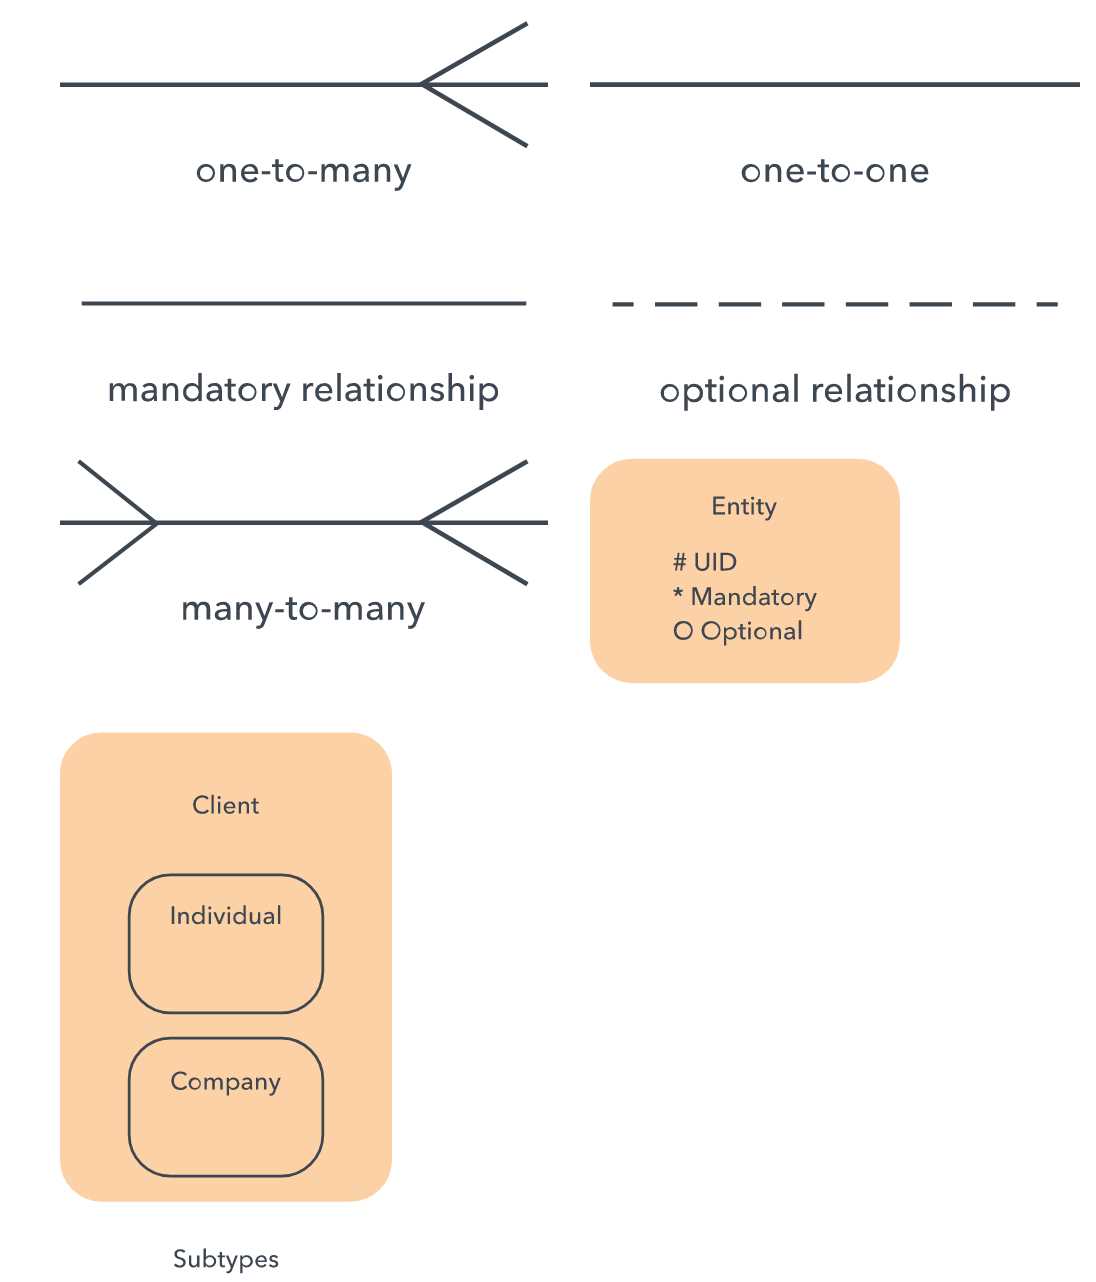
Step 4: Establish relationships between entities
After defining the entities and their attributes, it’s time to establish the relationships between them. Use the relationship shape tool to draw lines between the related entities. Label the relationships with the appropriate symbols, such as “1:1” for a one-to-one relationship or “1:N” for a one-to-many relationship.
Step 5: Fine-tune your diagram
Once you have established the basic structure of your ER diagram, you can fine-tune it by adjusting the layout, adding colors or icons, and including additional details such as primary keys or foreign keys. Lucidchart offers a range of formatting options to customize your diagram according to your preferences.
Step 6: Share and collaborate
Finally, when you are satisfied with your ER diagram, you can share it with others by generating a shareable link or inviting collaborators. Lucidchart allows real-time collaboration, so multiple users can work on the same diagram simultaneously, making it easier to gather feedback and make changes as needed.
By following these steps, you can create an effective and visually appealing ER diagram using Lucidchart. Whether you are a database designer, developer, or analyst, Lucidchart offers the flexibility and tools needed to create professional-grade diagrams for your projects.
Create a new document
Creating a new document in Lucidchart is an easy and straightforward process. To start creating a new document, follow these steps:
- Open Lucidchart: Launch the Lucidchart application or go to the Lucidchart website in your web browser.
- Sign in or create an account: If you already have a Lucidchart account, sign in using your credentials. Otherwise, click on the “Sign up for free” button to create a new account.
- Choose a template or start from scratch: Lucidchart provides a variety of templates for different types of diagrams, such as ER diagrams, flowcharts, and org charts. You can either select a template that suits your needs or choose to start with a blank document.
- Customize your document: Once you have selected a template or started with a blank document, you can customize it according to your requirements. Lucidchart offers a range of tools and features to help you create professional-looking diagrams, including shapes, icons, connectors, and text boxes.
- Save and export: After you have finished creating your document, make sure to save it. Lucidchart automatically saves your work, but it’s still a good practice to save manually. You can also export your document in various formats, such as PDF, PNG, and SVG.
By following these steps, you can easily create a new document in Lucidchart and start designing your ER diagram or any other type of diagram.
Add entities and relationships
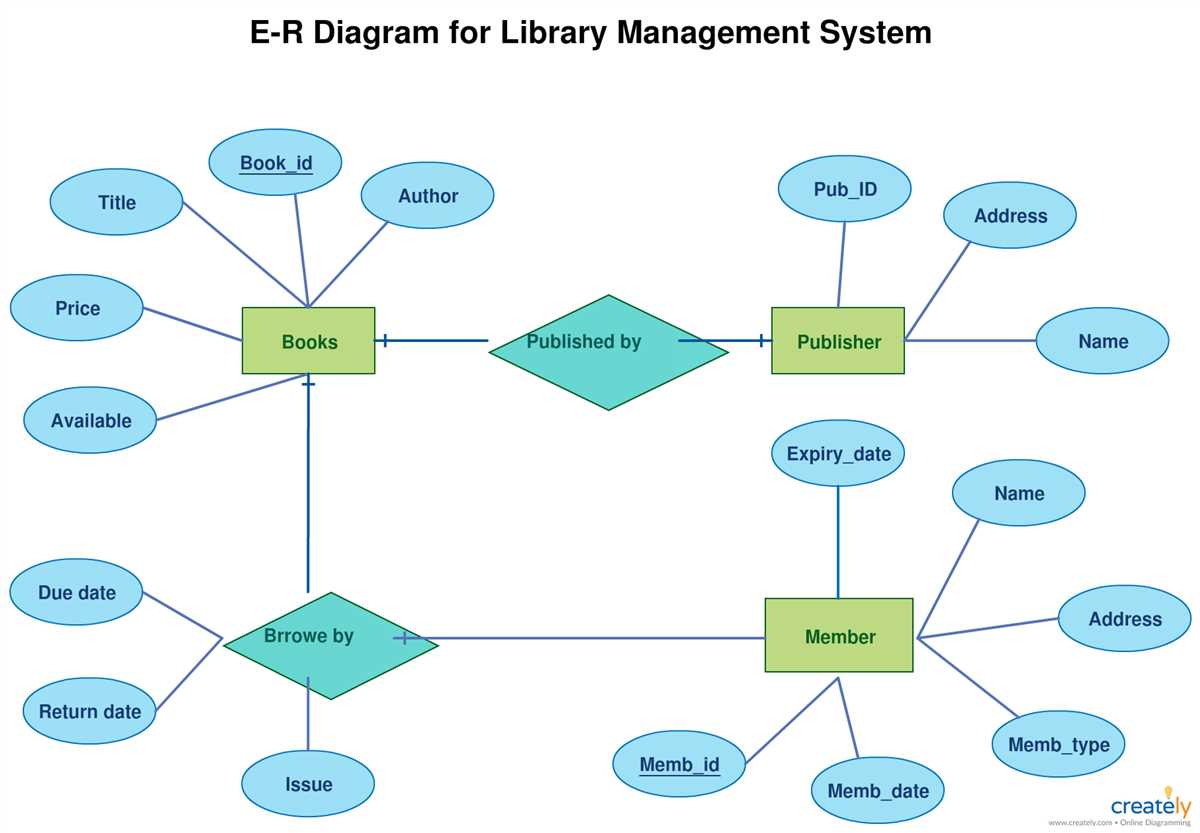
Lucidchart is a powerful tool that allows you to create Entity-Relationship (ER) diagrams easily. In order to create an ER diagram in Lucidchart, you need to first add entities and relationships to your diagram.
Entities represent the different objects or concepts that are part of your database. These can be anything from customers, products, or employees. To add an entity to your diagram, simply click on the “Entity” shape in the toolbar and drag it onto the canvas. You can then give the entity a name and customize its appearance by changing the color, shape, or size.
Relationships, on the other hand, describe the associations between entities. They define how the entities are connected and interact with each other. To add a relationship to your diagram, click on the “Relationship” shape in the toolbar and drag it onto the canvas. Then, connect the relationship to the entities it is associated with by clicking and dragging from the relationship to the entities. You can also add labels or descriptions to the relationships to provide more information.
Once you have added entities and relationships to your diagram, you can arrange and organize them to create a clear and logical representation of your database. Lucidchart offers a variety of formatting options, such as grouping entities, aligning them, or adding color coding, to make your diagram visually appealing and easy to understand.
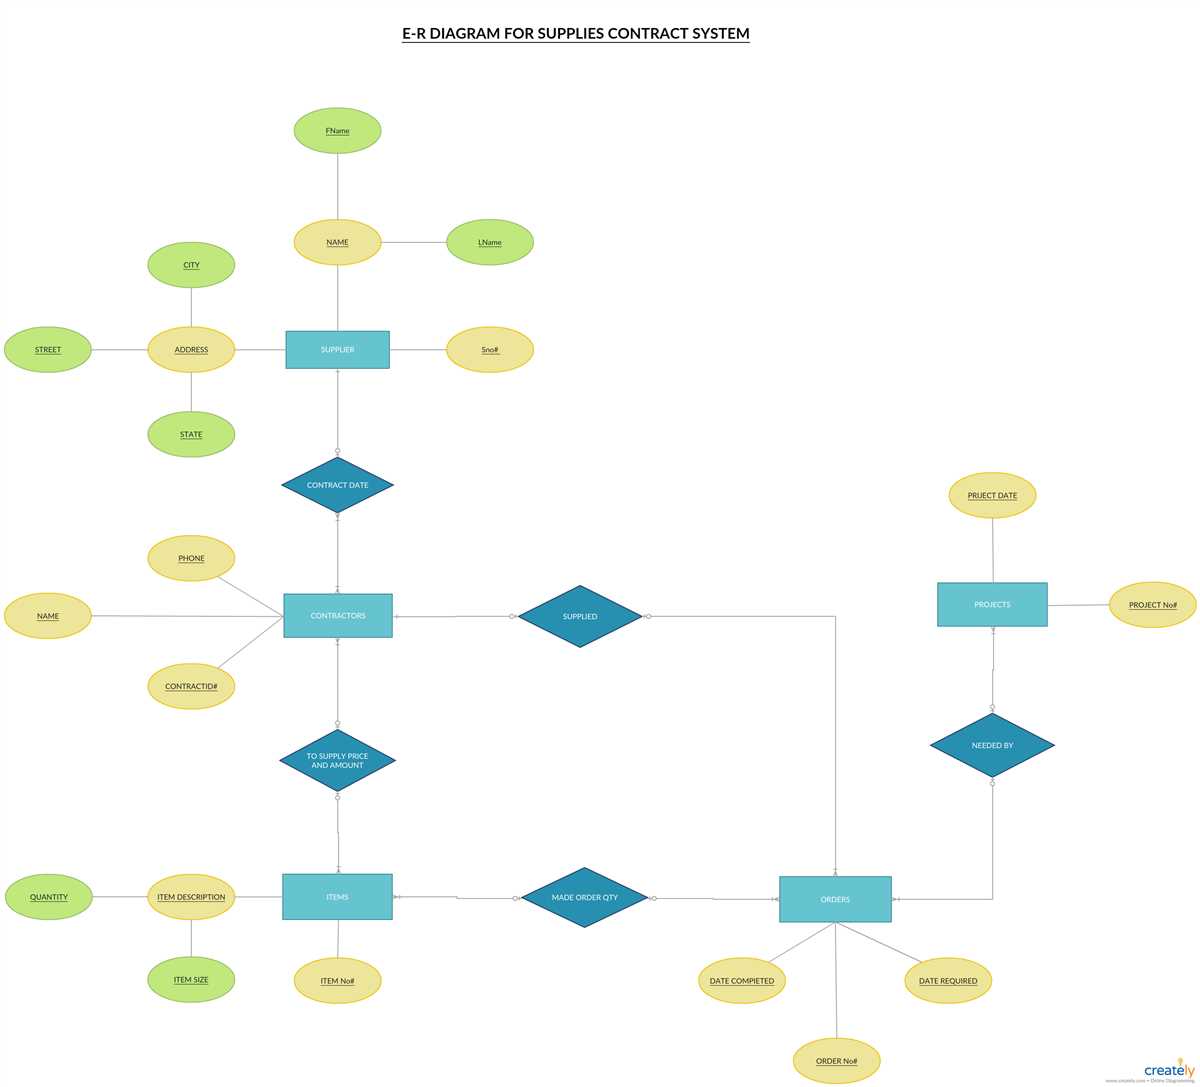
Add attributes and primary keys
In Lucidchart ER Diagram, you can easily add attributes to entities to define the characteristics or properties of each entity.
To add attributes, simply select the entity you want to add attributes to and click on the “Add Attribute” button in the toolbar. A new row will appear in the entity with columns for Name, Data Type, and Description. Fill in the details for each attribute.
Additionally, you can designate primary keys for entities to uniquely identify each record in the database. To mark an attribute as a primary key, simply select the attribute row and click on the “Primary Key” button in the toolbar. The attribute will be highlighted to indicate that it is a primary key.
Adding attributes and primary keys helps in defining the structure and relationships of your database model. It allows for accurate representation of data and helps in organizing and querying the database effectively.
Overall, Lucidchart ER Diagram provides a user-friendly interface to add attributes and designate primary keys for entities, contributing to a comprehensive and well-structured database model.