
In the field of materials science and engineering, the study of binary phase diagrams is essential for understanding the behavior of different substances when they are mixed together. These diagrams provide a visual representation of the various phases that can exist at different temperatures and compositions. They also help researchers predict the microstructures and properties of materials.
Many questions arise when studying binary phase diagrams, especially for those new to the field. What are the different phases that can exist? How can one determine the composition of each phase? How do temperature and pressure affect phase transformations? These questions and more will be answered in this article.
Firstly, it is important to understand the concept of phases. In the context of binary phase diagrams, a phase refers to a homogeneous portion of a material that has uniform physical and chemical properties. Phases can be solid, liquid, or gaseous, and they can exist in varying compositions at different temperatures and pressures.
Secondly, binary phase diagrams typically consist of two axes: temperature and composition. The temperature axis represents the range of temperatures at which the material is studied, while the composition axis represents the varying ratios of the two substances being mixed. By plotting temperature against composition, researchers can identify different phases and phase boundaries.
Binary Phase Diagram Questions and Answers
A binary phase diagram is a graphical representation of the relationships between the phases that exist in a mixture of two components as a function of temperature, pressure, and composition. It provides valuable information about the stability, transformations, and behavior of different phases in a binary system. Here are some common questions and answers related to binary phase diagrams:
1. What is a binary phase diagram?
A binary phase diagram is a graphical representation of the different phases that exist in a binary system. It shows how the composition, temperature, and pressure affect the stability and transitions between different phases.
2. How can a binary phase diagram be useful?
A binary phase diagram can provide important information about the behavior of a mixture of two components. It helps in understanding the solubility, phase transformations, and chemical reactions that occur in the system. It is also useful in designing and controlling industrial processes and predicting the physical properties of materials.
3. What are the different phases shown in a binary phase diagram?
Common phases shown in a binary phase diagram include solid solutions, liquid solutions, eutectics, eutectoids, peritectics, and other intermediate phases. These phases are represented by different regions or lines in the diagram.
4. How can the composition of a mixture be determined from a binary phase diagram?
The composition of a mixture can be determined from a binary phase diagram by determining the point where the vertical line representing the composition intersects with the phase boundaries or regions. This gives the relative proportions of the components in the mixture.
5. Can a binary phase diagram change with temperature and pressure?
Yes, a binary phase diagram can change with temperature and pressure. Changes in temperature and pressure can cause phase transitions, shifts in the phase boundaries, and changes in the stability of different phases in the system.
6. How can a binary phase diagram be used in materials science?
In materials science, binary phase diagrams are used to study the behavior of alloys, ceramic materials, and other mixtures. They help in understanding the microstructure, mechanical properties, and processing conditions of materials. They are also used in the development of new materials with tailored properties.
In conclusion, a binary phase diagram is a valuable tool for understanding and predicting the behavior of binary systems. It provides information about the phases present, their stability, and the compositional ranges in which they exist. It is an essential tool in various fields, including materials science, chemistry, and engineering.
What is a binary phase diagram?
A binary phase diagram is a graphical representation of the relationship between temperature, pressure, and the composition of a binary system. It shows how the different phases of a mixture of two components, usually represented on the x and y axes, change as temperature and pressure vary.
Binary phase diagrams are typically used in materials science, chemistry, and engineering to understand and predict the behavior of mixtures. They provide valuable information about the stability of different phases, the conditions at which phase transitions occur, and the composition of the phases at equilibrium.
In a binary phase diagram, the different phases of the mixture are represented by different regions, such as liquid, solid, or gas. The boundaries between these regions indicate the conditions at which phase transitions occur, such as the melting or boiling points. The composition of each phase is typically indicated by the fraction of each component in the mixture.
By studying binary phase diagrams, researchers can better understand the properties and behavior of materials and develop new materials with desired properties. They can also determine the optimal conditions for processing and manipulating materials, such as heat treatment processes or alloy design.
How are binary phase diagrams used in materials science?
Binary phase diagrams are a valuable tool in materials science for understanding the relationship between different materials and their phases at various temperatures and compositions. These diagrams provide a visual representation of the different phases that form in a binary system, such as a metal alloy, at equilibrium.
By examining a binary phase diagram, scientists and engineers can determine the temperature and composition conditions under which different phases will form. This information is crucial for designing and controlling the processing of materials, such as in the production of alloys or the heat treatment of metals. For example, knowing the phase diagram of a particular alloy can help determine the appropriate temperature and cooling rate needed to achieve specific mechanical or thermal properties.
Binary phase diagrams also offer insights into the microstructural evolution of materials. By understanding the transformations that occur at different temperatures and compositions, researchers can predict the final microstructure of a material and tailor its properties accordingly. This is particularly important in the development of advanced materials with specific characteristics, such as high strength, corrosion resistance, or thermal stability.
In addition, binary phase diagrams are fundamental for studying phase equilibria and phase transformations in materials. They provide a basis for understanding more complex phase diagrams involving multiple components, such as ternary or quaternary systems. By studying the behavior of binary systems, scientists can expand their knowledge of materials and apply this understanding to a wide range of practical applications in industries such as aerospace, automotive, and electronics.
Phases in a binary phase diagram
A binary phase diagram is a graphical representation that shows the different phases present in a two-component system as a function of temperature and composition. It provides valuable information about the behavior and transformation of materials under different conditions.
There are several phases that can exist in a binary phase diagram, depending on the composition and temperature. These phases can be categorized into two main groups: liquid phases and solid phases.
Liquid phases
Within the liquid region of a binary phase diagram, there may be two types of liquid phases: a single-phase liquid and a two-phase liquid. A single-phase liquid is a homogeneous mixture of the two components, where the atoms or molecules are evenly distributed throughout the entire system. A two-phase liquid represents a mixture of two separate liquid phases, which may have different compositions and properties. These liquid phases can coexist at certain temperature and composition ranges.
Solid phases
The solid region of a binary phase diagram consists of different types of solid phases. These solid phases can be further divided into terminal solid solutions, intermediate phases, and compounds.
- Terminal solid solutions: Terminal solid solutions are solid phases that can exist over a specific composition and temperature range. They exhibit complete solubility of the two components, where the atoms or molecules of both components are randomly distributed throughout the crystal lattice.
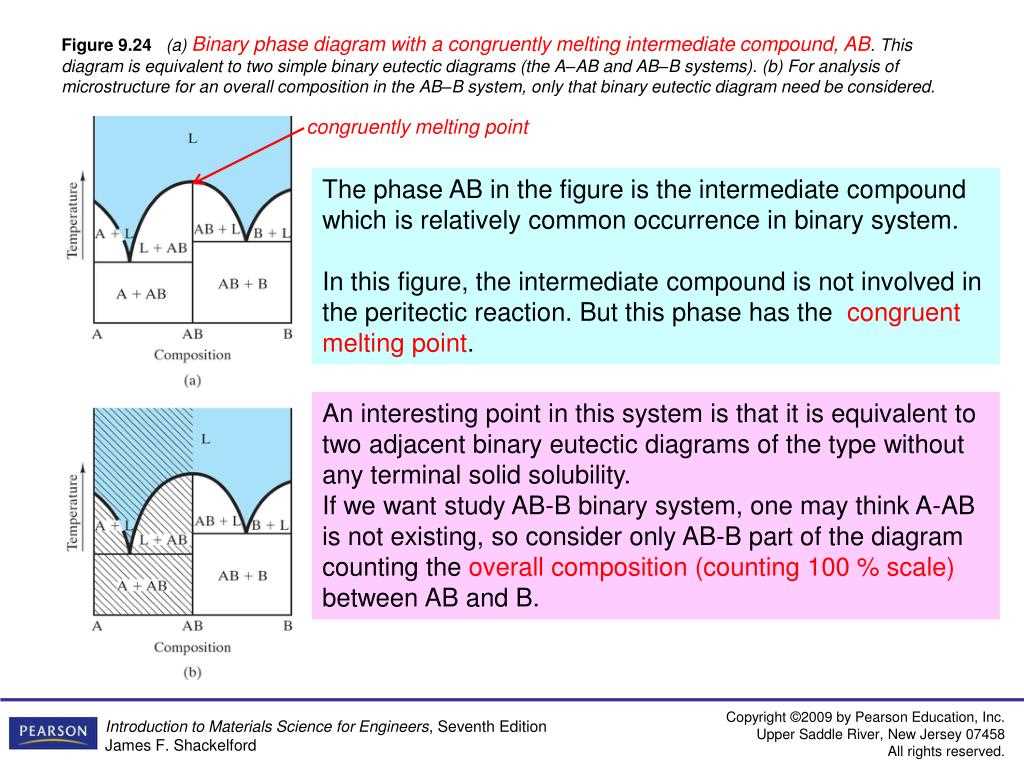
- Intermediate phases: Intermediate phases are solid phases that form within a limited composition range. These phases have distinct crystal structures and properties that differ from the terminal solid solutions.
- Compounds: Compounds are solid phases that have a fixed stoichiometry and specific crystal structure. They form at specific compositions and can have different properties compared to the terminal solid solutions and intermediate phases.
In summary, a binary phase diagram depicts the different phases that can exist in a two-component system at various temperatures and compositions. These phases include liquid phases, such as single-phase and two-phase liquids, and solid phases, which include terminal solid solutions, intermediate phases, and compounds.
How is a binary phase diagram constructed?
Constructing a binary phase diagram involves several steps and considerations to accurately represent the relationship between temperature, pressure, and composition of two components. These diagrams are crucial in understanding the behavior and properties of different materials and their phase transformations. The following points outline the process of constructing a binary phase diagram:
Determining the Components:
The first step is to identify the two components that will be represented in the phase diagram. These components can be elements or compounds, and they should have a mutual solubility to form solid solutions or compounds. The components are typically represented on the x and y-axis of the diagram.
Experimental Data Collection:
Experimental data is necessary to determine the various phases and their boundaries in the binary system. This data can be obtained through techniques such as differential thermal analysis, microscopic observation, and X-ray diffraction. It is important to collect data at different compositions and temperatures to capture the behavior of the system accurately.
Plotting the Phase Boundaries:
Based on the collected experimental data, the phase boundaries are plotted on the phase diagram. These boundaries represent the temperature and composition ranges at which different phases coexist in equilibrium. For example, the liquidus line represents the temperature at which the system transitions from a solid to a liquid phase.
Phase Regions and Compositions:
The phase diagram is divided into distinct regions based on the composition and temperature. These regions represent different phases or combinations of phases that exist within a specific temperature and composition range. The phase regions can include solid solutions, eutectics, peritectics, and other phase transformations.
By carefully constructing a binary phase diagram, scientists and engineers can gain insights into the behavior of materials and make informed decisions regarding the processing and synthesis of alloys or compounds.
What information can be obtained from a binary phase diagram?
A binary phase diagram provides valuable information about the behavior and properties of a mixture composed of two chemical compounds, known as a binary system. It shows the different phases that can exist in equilibrium as a function of temperature and composition. By analyzing a binary phase diagram, several important pieces of information can be obtained:
- Phase boundaries: The phase diagram illustrates the boundaries between different phases, such as solid, liquid, and gas. This information allows us to determine the conditions under which each phase is stable.
- Phase compositions: The diagram provides the composition ranges at which each phase is present. This allows us to determine the composition of a mixture in equilibrium with a specific phase.
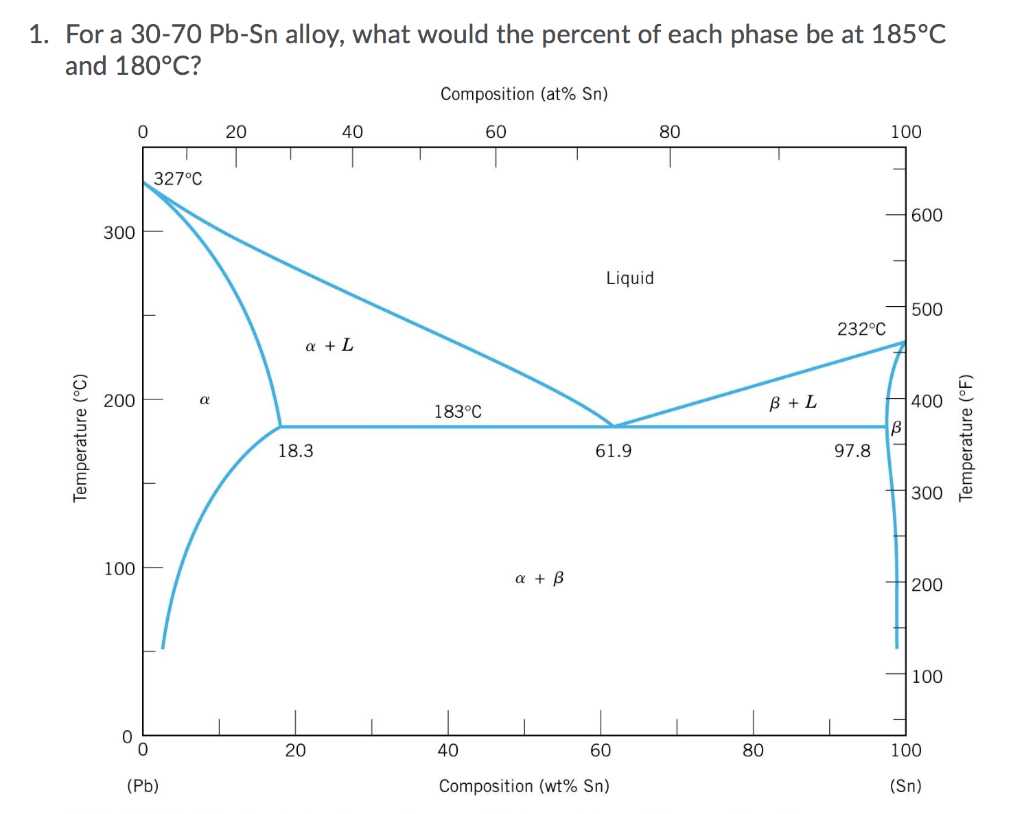
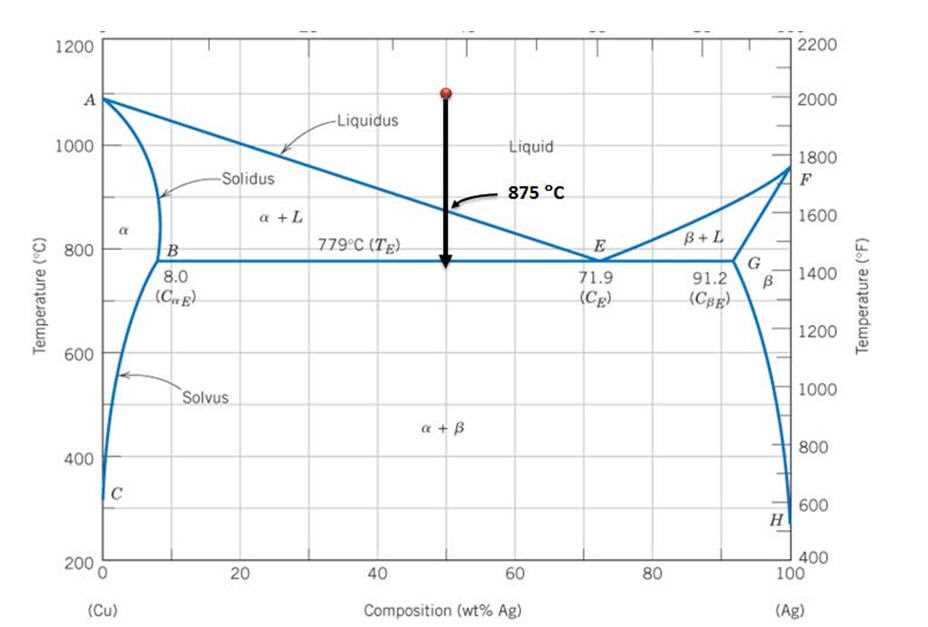
- Eutectic composition: The eutectic composition is the composition at which the mixture has the lowest melting point. The binary phase diagram shows the eutectic composition, which is important for understanding the alloying behavior of metals.
- Eutectic temperature: The eutectic temperature is the lowest temperature at which the mixture is completely liquid. The phase diagram provides the eutectic temperature, which is essential for controlling the solidification process in metallurgy.
- Solid solubility: The phase diagram shows the solubility limits for solid solutions between the two compounds. This information is crucial for understanding the formation of alloys and the control of impurity levels in materials.
In summary, a binary phase diagram provides valuable information about the phase behavior, phase compositions, eutectic points, and solid solubility of a binary system. This information is crucial for understanding and controlling the properties and behavior of materials in various fields such as metallurgy, materials science, and chemistry.
Practical Applications of Binary Phase Diagrams
A binary phase diagram is a graphical representation of the different phases that can exist in a two-component system at various compositions and temperatures. These diagrams are widely used in materials science, metallurgy, and other fields to predict and understand the behavior of alloys and other mixtures. Here are some of the practical applications of binary phase diagrams:
1. Alloy Design and Composition: Binary phase diagrams provide valuable information about the phase stability and composition range of different alloys. Engineers and materials scientists can use these diagrams to design and select the right composition of alloys for specific applications, such as in the automotive, aerospace, and electronics industries. For example, a phase diagram can help identify the composition of an alloy that will have the desired combination of strength, corrosion resistance, and other properties.
2. Heat Treatment and Processing: Phase diagrams are also used in heat treatment processes, where materials are subjected to controlled heating and cooling cycles to achieve desired properties. The phase diagram provides guidance on the temperature ranges at which specific phases form and transform, allowing engineers to optimize the heat treatment process for a particular alloy or material.
3. Material Characterization: Binary phase diagrams are used as a tool for material characterization. They help identify the phases present in a given alloy or material at a specific composition and temperature. This information is essential for understanding the microstructure and properties of the material, such as hardness, electrical conductivity, or magnetic behavior.
4. Quality Control and Failure Analysis: Phase diagrams play a crucial role in quality control and failure analysis of materials. By comparing the actual phase composition of a material with the expected phase composition from the phase diagram, engineers can identify deviations and potential issues that may affect the performance or reliability of the material.
5. Education and Research: Binary phase diagrams are extensively used in education and research as a fundamental tool for understanding the thermodynamics and kinetics of phase transformations. They provide a visual representation of the complex relationship between composition, temperature, and phase behavior, helping students and researchers grasp the underlying principles of materials science.
In conclusion, binary phase diagrams have a wide range of practical applications in various industries and fields. They are essential for alloy design, heat treatment processes, material characterization, quality control, and education and research. Understanding and interpreting these diagrams enable engineers and scientists to make informed decisions regarding the selection, processing, and performance evaluation of materials.
Q&A:
What are binary phase diagrams used for?
Binary phase diagrams are used to describe the relationships between the phases present in a material system at different compositions and temperatures.
How are binary phase diagrams helpful in materials science and engineering?
Binary phase diagrams provide valuable information about the microstructure and properties of materials, allowing materials scientists and engineers to design and optimize materials for specific applications.
What can binary phase diagrams tell us about alloys?
Binary phase diagrams can reveal the phases that are present in an alloy at different compositions and temperatures, as well as the composition ranges over which each phase is stable. This information is crucial for understanding and predicting the behavior of alloys in various applications.
How do binary phase diagrams help in the development of new materials?
By studying binary phase diagrams, researchers can identify compositions and processing conditions that lead to desirable properties in materials. This knowledge helps in the development of new materials with improved performance and functionality.
What industries benefit from the use of binary phase diagrams?
Industries such as automotive, aerospace, electronics, and materials manufacturing can benefit from the use of binary phase diagrams. These industries rely on materials with specific properties, and understanding phase relationships helps in the design and production of such materials.
What are the practical applications of binary phase diagrams?
Binary phase diagrams are used in several practical applications. One of the main applications is in metallurgy, where they are used to understand and control the composition and structure of alloys. These diagrams help engineers to determine the melting points, solidification behavior, and phase transformations that occur in different alloy systems. This information is crucial for designing and manufacturing various metallic products, such as steel, aluminum alloys, and copper alloys. Another practical application of binary phase diagrams is in the field of materials science and engineering. They can provide valuable insights into the fabrication and processing of materials, as well as their thermal stability and mechanical properties. By studying the phase diagram of a material, scientists and engineers can optimize the production processes, improve the performance of materials, and design new materials with desirable properties.
How are binary phase diagrams used in materials science and engineering?
In materials science and engineering, binary phase diagrams are used for various purposes. They help researchers and engineers to understand the relationship between composition, structure, and properties of materials. By studying the diagrams, scientists can predict the behavior and characteristics of different phases that form in a material at different compositions and temperatures. This information is important for designing and optimizing the fabrication processes of materials. For example, phase diagrams can be used to determine the solidification behavior of alloys during casting or the formation of desired microstructures during heat treatment. They also provide insights into the thermal stability and mechanical properties of materials. By using binary phase diagrams, engineers can select appropriate materials for specific applications, improve the performance of materials, and design new materials with desired properties.