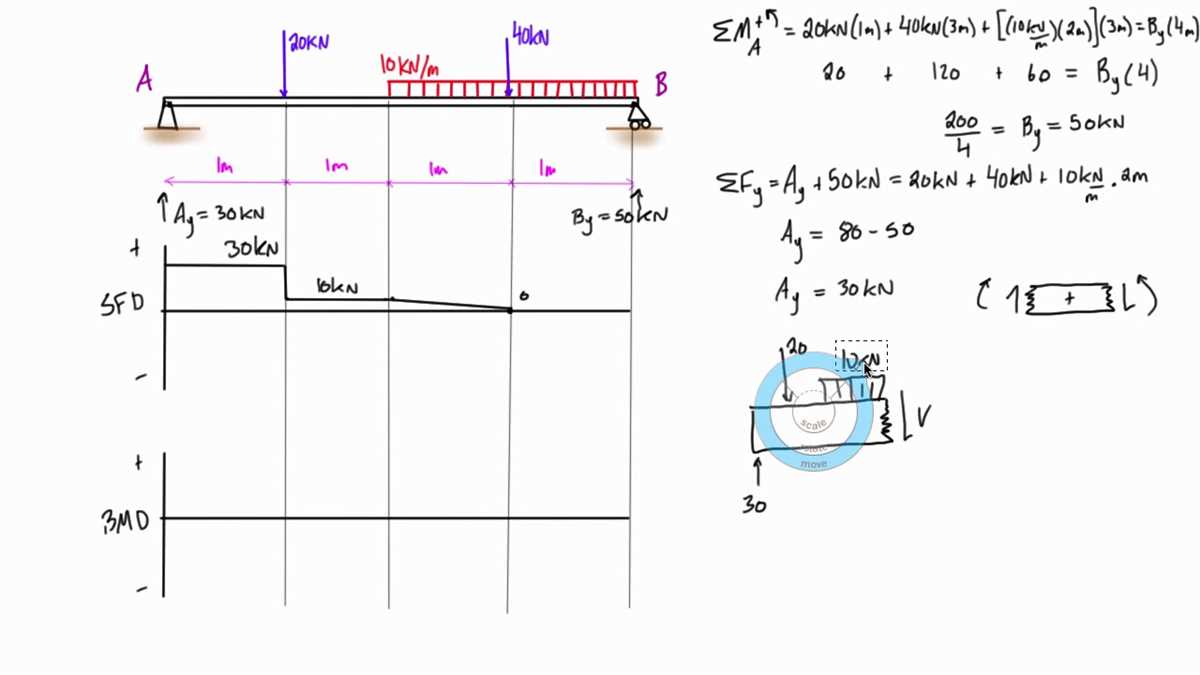
In structural engineering, shear and moment diagrams are graphical representations used to analyze the internal forces within a structural element. These diagrams show the distribution of shear forces and bending moments along the length of the element, providing valuable insights into the structural behavior under various loading conditions.
Distributed loads, also known as continuous loads, are forces that are distributed along the length of the element rather than being concentrated at specific points. Examples of distributed loads include the weight of a beam, the force exerted by a fluid on a structure, or the load applied by a mass distributed over an area.
When analyzing a structure with distributed loads, shear and moment diagrams are essential tools for determining the internal forces and their magnitudes along the length of the element. The shear diagram shows the variation of shear force at each point along the element, while the moment diagram depicts the variation of bending moment.
Shear and Moment Diagrams with Distributed Loads
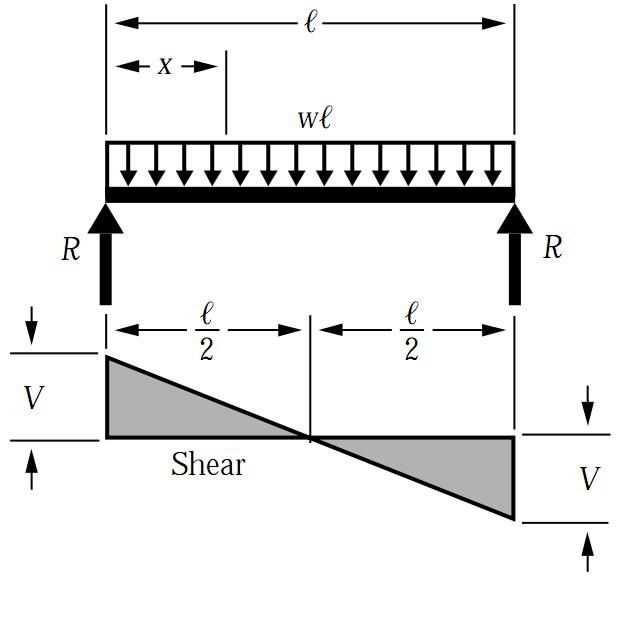
In structural engineering, shear and moment diagrams are tools used to analyze the distribution of forces and moments along a beam. When considering distributed loads, which are loads that are evenly distributed along a length of the beam, these diagrams become particularly useful.
The shear diagram represents the variation of the vertical shear force along the length of the beam. It shows how the shear force changes as you move along the beam. A positive shear force indicates a tendency to rotate the beam in a clockwise direction, while a negative shear force indicates a tendency to rotate the beam in a counterclockwise direction.
The moment diagram, on the other hand, represents the variation of the bending moment along the length of the beam. It shows how the bending moment changes as you move along the beam. A positive bending moment indicates sagging or concave-upward bending, while a negative bending moment indicates hogging or concave-downward bending.
To construct these diagrams, you need to consider the distributed load acting on the beam, its intensity, and the length over which it acts. By calculating the shear and moment at certain points along the beam, you can plot the diagrams. It is important to note that the diagrams will vary depending on the type and location of the distributed load.
Example: Shear and Moment Diagrams for a Simply Supported Beam with Uniformly Distributed Load
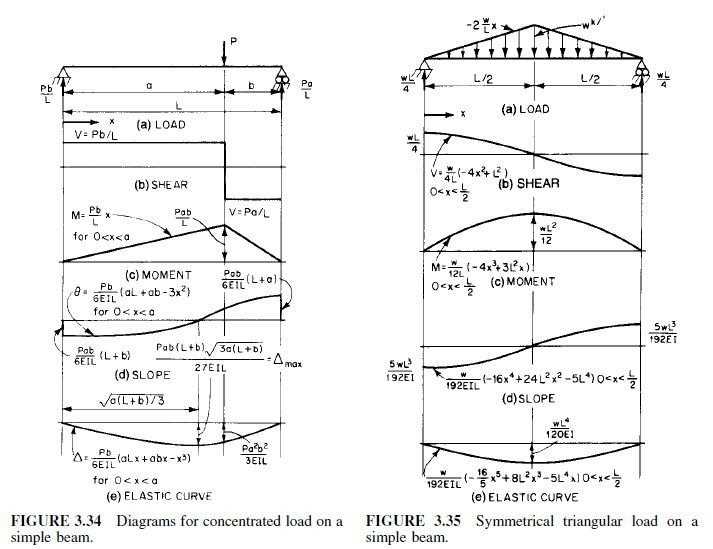
Let’s consider a simply supported beam with a uniformly distributed load. The load is acting along the entire length of the beam, and its intensity is defined as w (in force per unit length). To construct the shear and moment diagrams, we can follow these steps:
- Determine the reaction forces at the supports. These can be calculated using the equilibrium equations.
- Calculate the shear and moment at any point between the supports, using the equations derived from the equilibrium equations and the load distribution.
- Plot the shear diagram by starting with the reaction forces and adding or subtracting the shear at each point along the beam.
- Plot the moment diagram by integrating the shear diagram, starting with the moment at one of the supports.
By following these steps, we can visualize the distribution of forces and moments along the beam and better understand its structural behavior under the applied load. The shear and moment diagrams provide valuable information for structural design and analysis, helping engineers ensure the beam’s integrity and safety.
Understanding the Basics
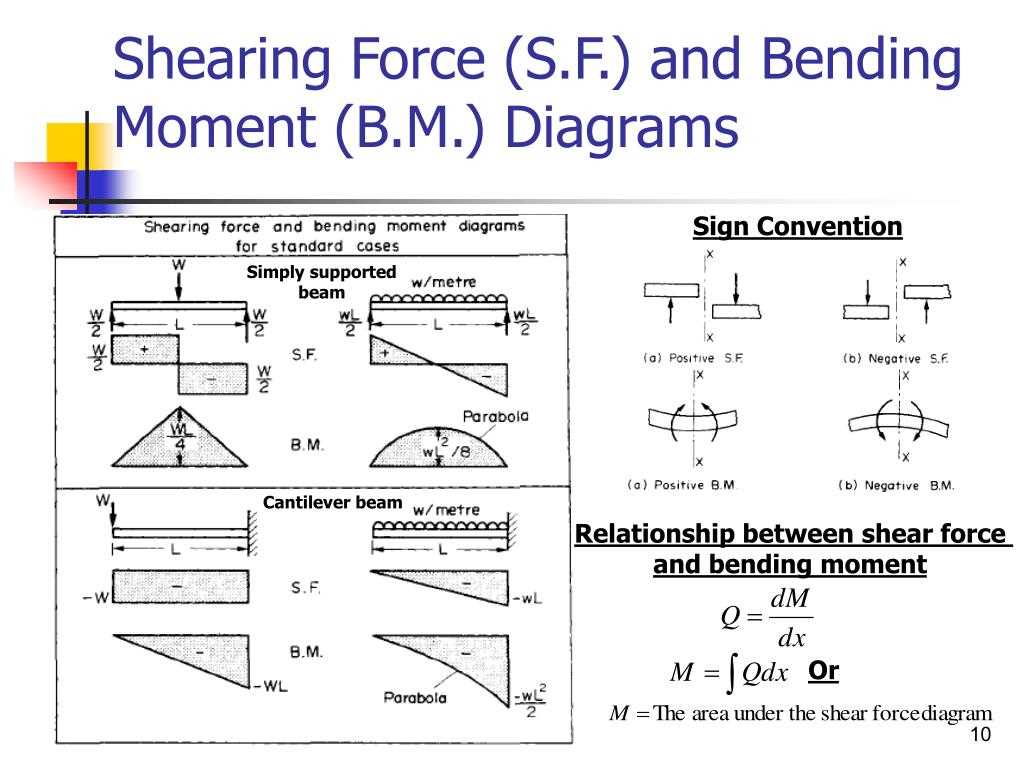
When analyzing and designing structures, it is essential to understand the basics of shear and moment diagrams with distributed loads. These diagrams provide valuable insight into the internal forces and moments that act on a structure, helping engineers ensure its stability and safety.
A shear diagram represents the variation of the shear force along the length of the structure. The shear force is the force that acts perpendicular to the axis of the structure, causing it to deform. By plotting the shear force at different points along the structure, engineers can identify critical points where the shear force is maximum or minimum. This information is crucial for properly designing structural elements to withstand these forces.
The moment diagram, on the other hand, illustrates the distribution of moments along the length of the structure. The moment is the tendency of a force to rotate an object. By plotting the moment at different points along the structure, engineers can determine where the maximum or minimum bending moments occur. Bending moments can cause the structure to deform or fail, so it is essential to design structures capable of withstanding them.
To construct shear and moment diagrams with distributed loads, engineers typically break down the distributed loads into smaller concentrated loads. These loads, along with any other applied loads or supports, are used to determine the shear and moment at different points along the structure. By systematically analyzing each segment, engineers can then plot the shear and moment diagrams, providing a comprehensive understanding of the internal forces and moments acting on the structure.
In summary, shear and moment diagrams with distributed loads are vital tools for engineers to analyze and design structures. They provide crucial information about the internal forces and moments acting on a structure, aiding in the proper design of structural elements to ensure their stability and safety.
Calculating Reactions
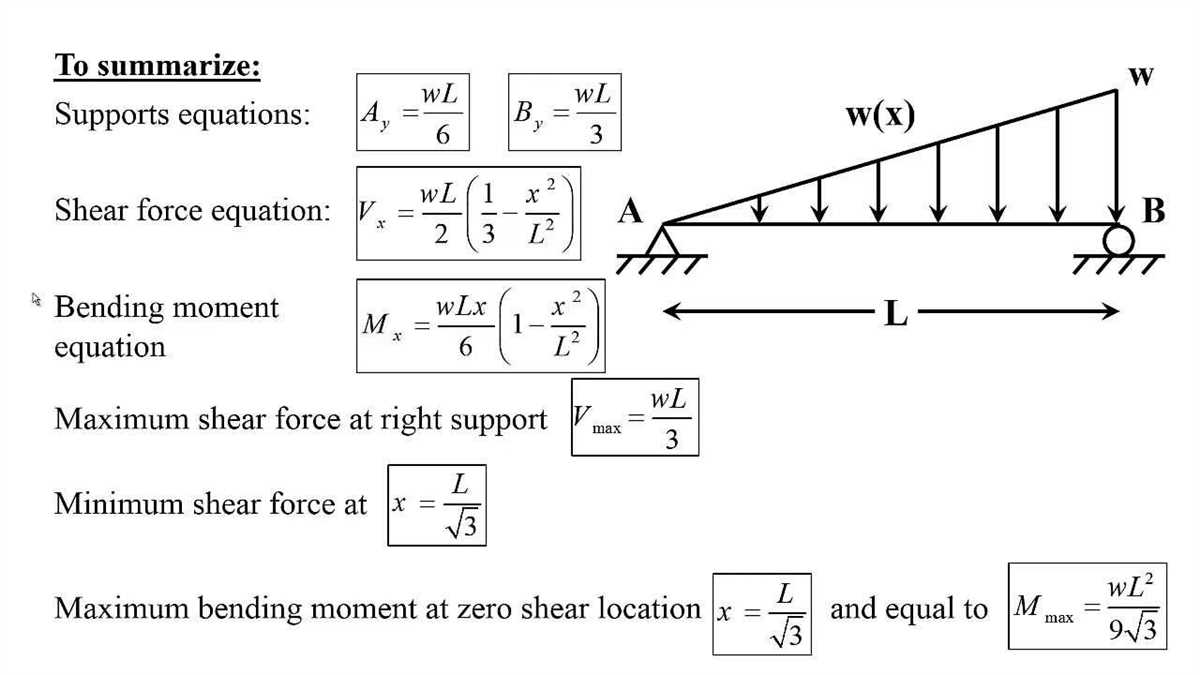
When analyzing a structure subjected to distributed loads, the first step is to calculate the reactions at the supports. The reactions represent the external forces that the structure exerts on its supports. These reactions play a crucial role in determining the internal forces and deformations of the structure.
To calculate the reactions, we need to consider the equilibrium conditions. For a structure in static equilibrium, the sum of the forces and moments acting on it must be zero. By applying these equilibrium conditions, we can solve for the unknown reactions.
For example, let’s consider a simply supported beam with a distributed load. The beam is supported at both ends, and we want to calculate the reaction forces at each support. We can start by summing the vertical forces to determine the reaction forces in the y-direction. The sum of the vertical forces must be zero, so we set up an equation:
- ΣFy = 0: RAy + RBy – w1 – w2 = 0
Here, RAy and RBy are the reaction forces at supports A and B, and w1 and w2 are the magnitudes of the distributed loads. By solving this equation, we can determine the values of RAy and RBy.
Once the reaction forces are known, we can proceed to calculate the shear and moment diagrams, which provide a graphical representation of the internal forces and moments along the length of the beam. These diagrams are essential for analyzing the strength and stability of the structure.
Constructing the Shear Diagram
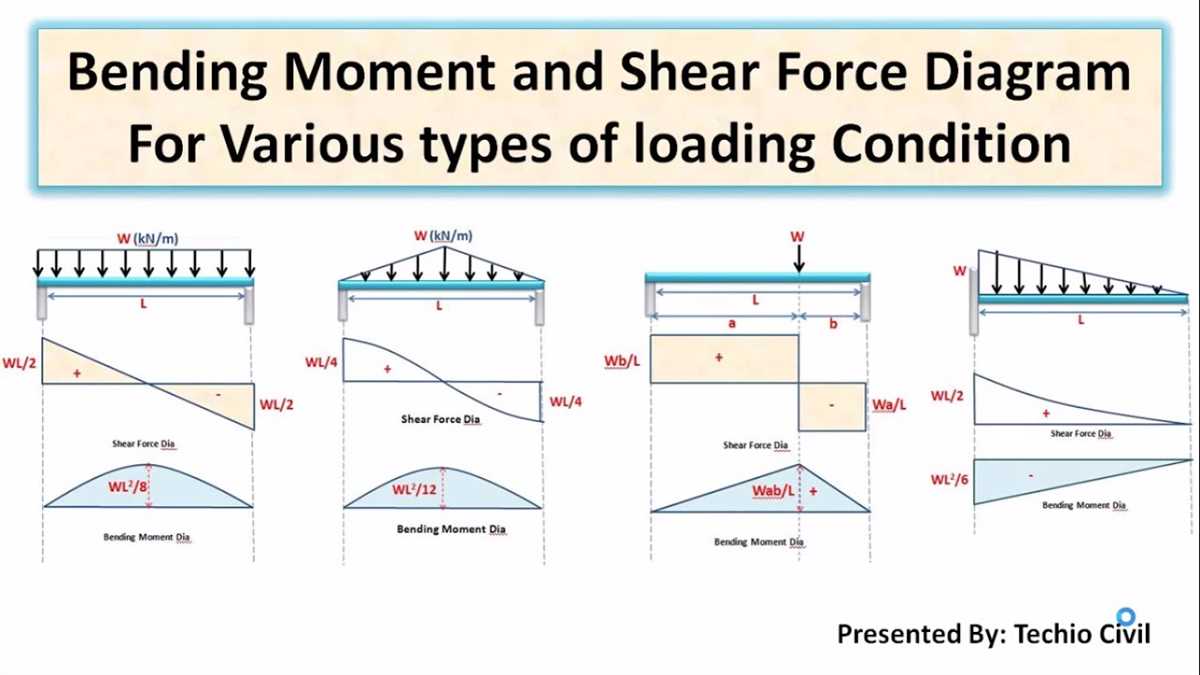
The shear diagram is an important tool in visualizing the distribution of shear forces along a beam. It helps engineers and designers understand how the internal forces vary along the beam’s length, which is crucial for determining its structural integrity and performance. To construct the shear diagram, several steps must be followed.
First, it is necessary to determine the reaction forces at the supports of the beam. These forces can be calculated using the principles of static equilibrium. Once the reaction forces are known, it becomes possible to determine the starting point of the shear diagram.
The next step is to identify points along the beam where the shear changes. These points are located at discontinuities in the loading, such as concentrated loads or changes in the distribution of distributed loads. At each of these points, the shear force is calculated, either using the equations of static equilibrium or by considering the effect of the loading on the shear diagram.
After determining the shear at various points along the beam, these values are plotted on a graph. The x-axis represents the position along the beam, while the y-axis represents the shear force. The plotted points are connected to form a continuous line, resulting in the shear diagram.
The shear diagram provides important information about the behavior of the beam under load. It allows engineers to identify critical points where the shear force is highest, which can help in determining the necessary strength and size of structural elements. It also aids in assessing the beam’s ability to withstand external loads and ensures its safe design and operation.
Calculating the Moment
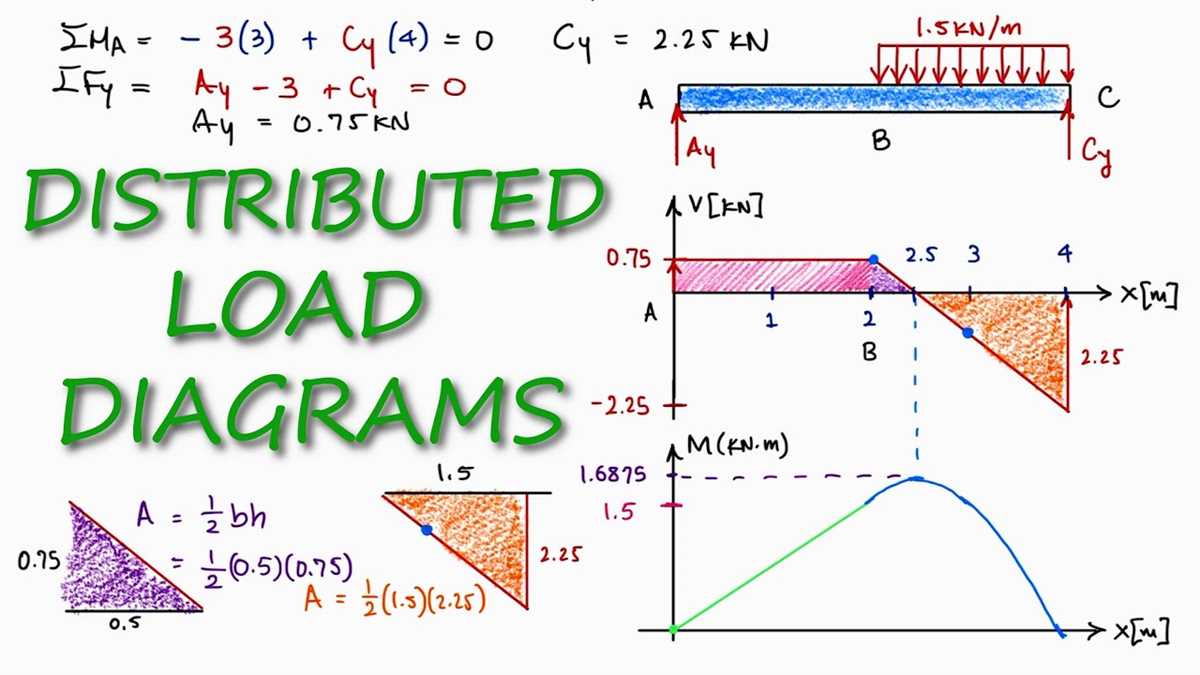
The moment of a force is a measure of its tendency to cause a body to rotate around a specific point or axis. It is calculated by multiplying the magnitude of the force by the perpendicular distance from the point or axis to the line of action of the force.
In the context of shear and moment diagrams with distributed loads, calculating the moment involves determining the magnitude and distance of the distributed load at each point along the beam. The moment at any given point can be found by summing the moments from the left end of the beam to that point.
To calculate the moment due to distributed loads, the load intensity (force per unit length) is multiplied by the perpendicular distance from the point of interest to the line of action of the distributed load. This produces a moment value. The moments at multiple points along the beam are then plotted on a shear and moment diagram to visualize the distribution of moments along the beam.
It is important to note that the calculation of moments also takes into account any concentrated loads or moments applied to the beam. The net moment at any point is the sum of the moments from the distributed load and the concentrated loads or moments.
Plotting the Moment Diagram
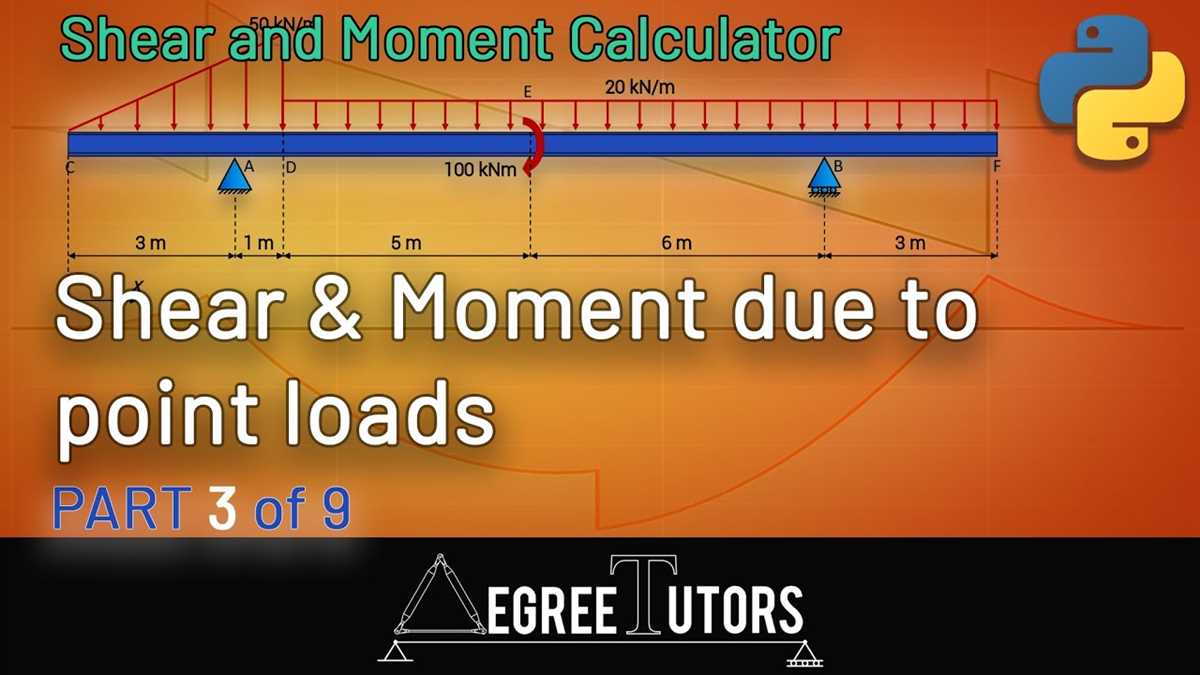
When analyzing a structure under distributed loads, one important step is to plot the moment diagram. The moment diagram shows how the internal bending moment varies along the length of the beam. It provides invaluable information about the structural behavior and helps engineers determine whether the beam is strong enough to withstand the loads applied to it.
To plot the moment diagram, one must first calculate the shear force at various points along the beam. The shear force can be obtained by integrating the distributed load over the span of the beam. The shear force is then used to determine the changes in the bending moment along the beam.
Starting from one end of the beam, the engineer plots the initial bending moment (usually assumed to be zero) on the moment diagram. As the engineer moves along the beam, the bending moment is increased or decreased based on the magnitude and direction of the shear force at that particular point. By doing this at multiple points along the beam, a curve representing the moment diagram is obtained.
The moment diagram is typically drawn with the horizontal axis representing the length of the beam and the vertical axis representing the bending moment. The values of the bending moment are usually shown in units of force multiplied by distance (e.g., N·m or lb·ft).
The shape of the moment diagram provides important insights into the structural behavior of the beam. Points of maximum and minimum bending moments correspond to locations where the beam is most vulnerable to failure. By analyzing the moment diagram, engineers can design the structure to ensure it meets the required safety factor.
Applying the Superposition Principle
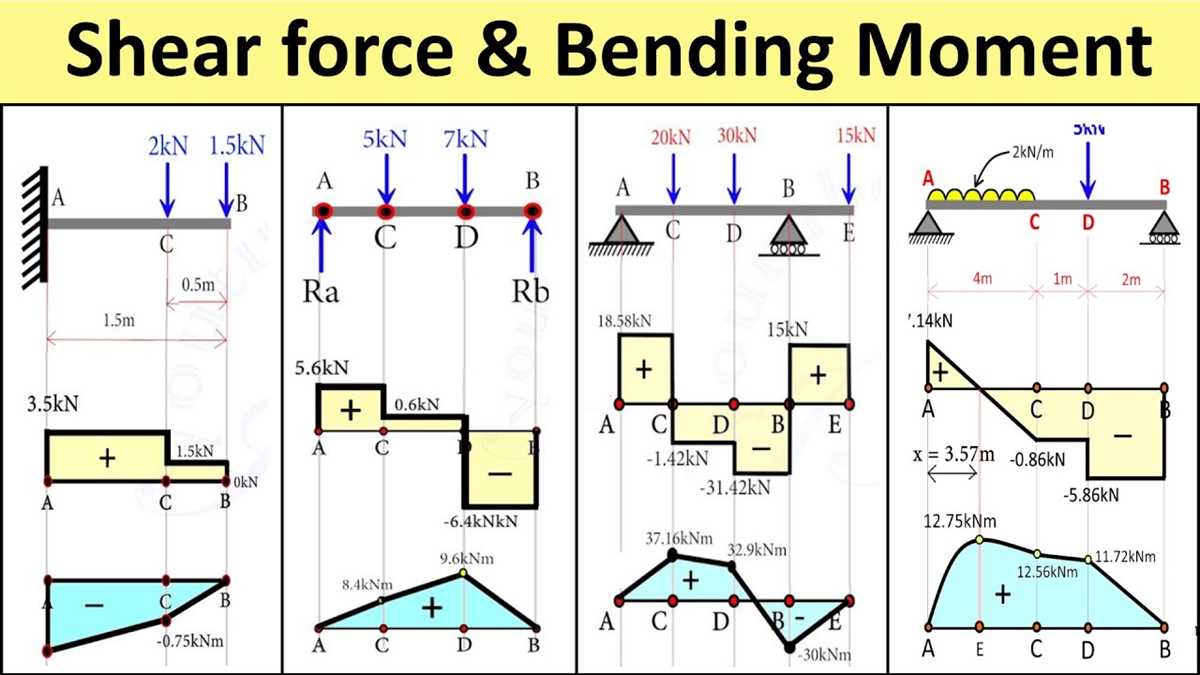
The superposition principle is a powerful technique used in structural analysis to determine the effects of multiple loads on a structure. It states that the response of a structure to a combination of loads can be determined by adding the responses to each individual load acting alone.
The superposition principle is particularly useful when dealing with distributed loads, as it allows us to determine the shear and moment diagrams for complex load distributions by considering each portion of the load separately and then adding the results together.
To apply the superposition principle, we follow these steps:
- Calculate the shear and moment diagrams for each individual load acting alone.
- Add the shear and moment diagrams obtained in step 1 together to obtain the final shear and moment diagrams for the combined loads.
By using the superposition principle, we can simplify the analysis of complex load distributions and determine the internal forces and moments at any point along the structure. This allows engineers to design structures that can safely support various loads and ensures the structural integrity of the system.
Overall, the superposition principle is a valuable tool in understanding the behavior of structures under different loadings. It simplifies the analysis process and allows engineers to accurately predict and design structures that can withstand a wide range of loads.