
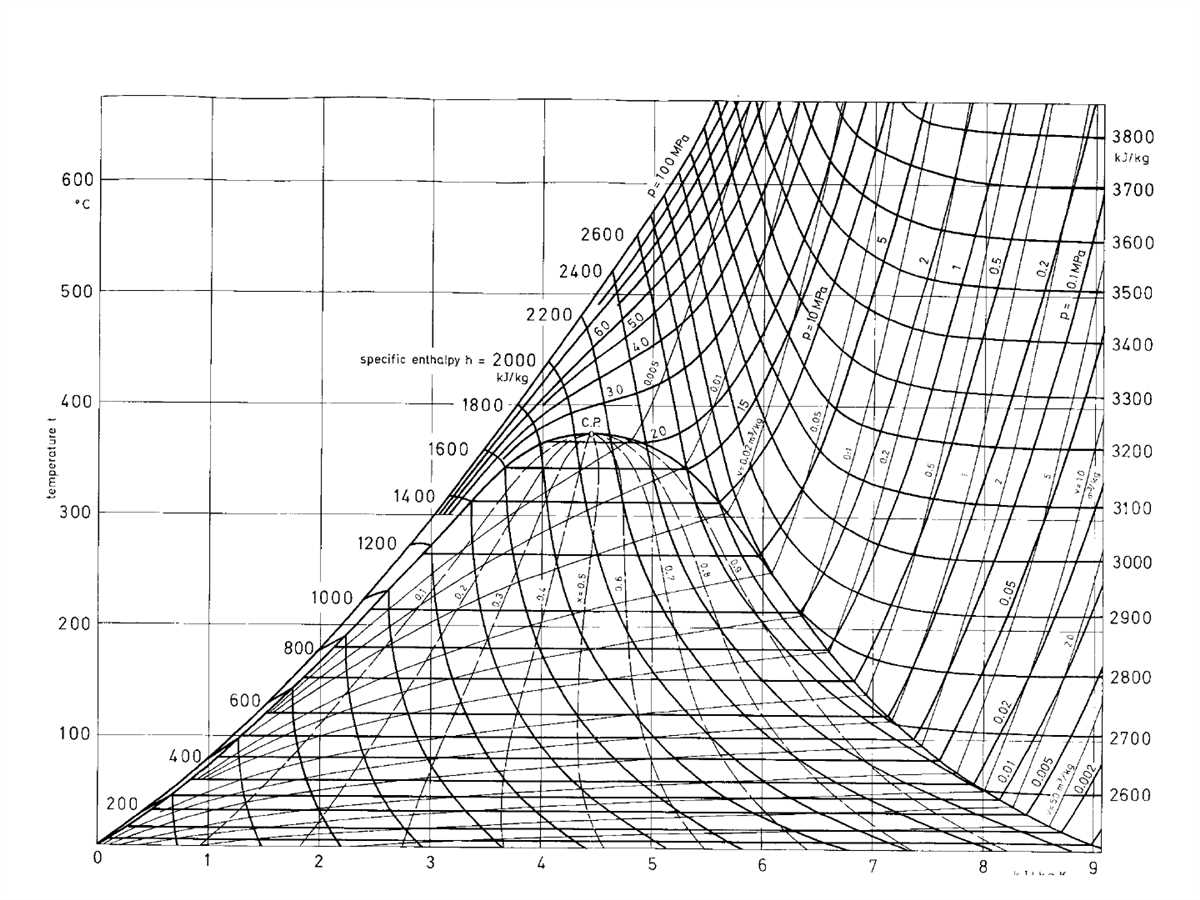
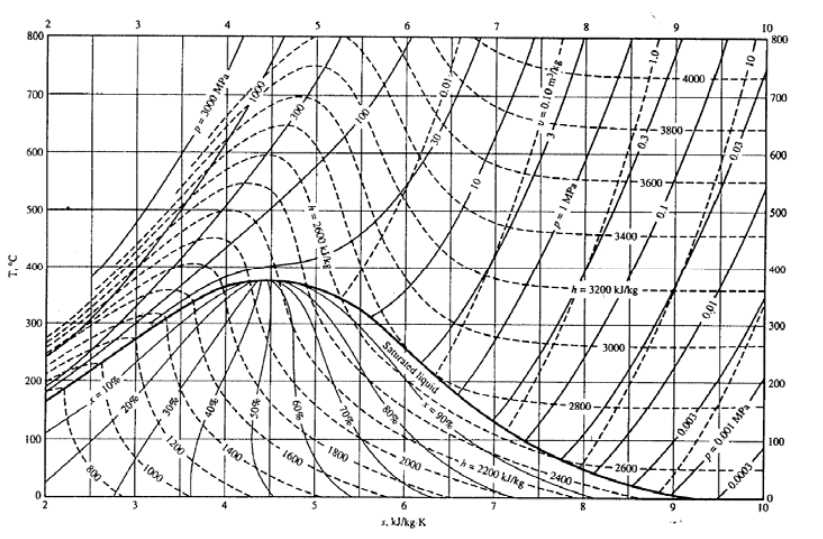
Thermodynamics is the study of energy transformations and the relationships between different forms of energy. One of the key tools used in this field is the T-s diagram, which is a graphical representation of the properties of a substance as it undergoes changes in temperature and entropy. The T-s diagram allows engineers and scientists to analyze and understand the behavior of materials and systems, particularly in the field of heat transfer.
The T-s diagram is a plot of temperature on the vertical axis and entropy on the horizontal axis. Entropy is a measure of the disorder or randomness of a system, while temperature is a measure of the average kinetic energy of the particles in a substance. By plotting these two variables on a graph, the T-s diagram provides a visual representation of how a substance changes as it undergoes different processes, such as heating, cooling, and phase transitions.
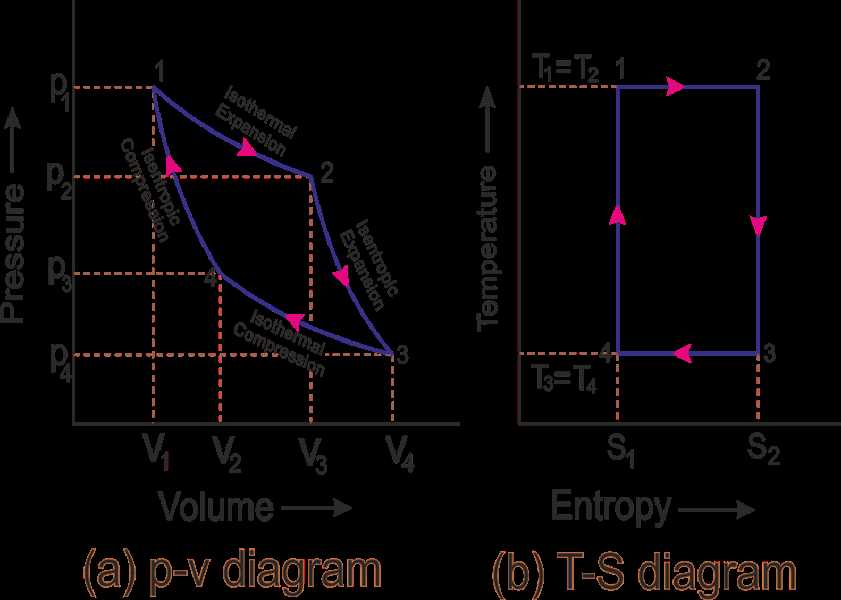
The T-s diagram is particularly useful in analyzing thermodynamic cycles, such as the Carnot cycle, Rankine cycle, and refrigeration cycles. These cycles involve the transfer of heat and work between a system and its surroundings, and the T-s diagram can help determine the efficiency and performance of these cycles. Additionally, the T-s diagram can be used to determine the critical point of a substance, which is the point at which it undergoes a phase transition from one state to another.
Definition of T-s diagram
The T-s diagram, also known as the Temperature-Entropy diagram or the Mollier diagram, is a graphical representation used in thermodynamics to analyze the behavior and properties of substances or systems.
This diagram plots temperature (T) against entropy (s), with the x-axis representing entropy and the y-axis representing temperature. The T-s diagram allows engineers and scientists to visualize the thermodynamic processes that occur in a system and to analyze the efficiency and performance of various processes and cycles.
In the T-s diagram, different regions represent different phases or states of the substance. For example, the vapor dome represents the region where both liquid and vapor phases coexist, while the superheated vapor region represents the state where the substance exists only as a vapor with temperature and entropy increasing.
The T-s diagram is particularly useful in analyzing thermodynamic processes, such as power cycles in engines or refrigeration cycles. By analyzing the shape and position of the curves on the diagram, engineers can determine the efficiency, work output, heat transfer, and other properties of the system.
In addition to its applications in engineering, the T-s diagram is also used in the field of HVAC (Heating, Ventilation, and Air Conditioning), where it is used to analyze and design energy-efficient heating and cooling systems. It provides a visual representation of the changes in temperature and entropy that occur during various processes, helping engineers optimize the performance of HVAC systems.
Properties and Significance of T-s Diagram
The T-s diagram, also known as the temperature-entropy diagram, is a graphical representation of the thermodynamic properties of a substance. It is widely used in the field of thermodynamics to analyze and understand the behavior of systems undergoing various processes.
The x-axis of the T-s diagram represents the entropy (S) of the system, while the y-axis represents the temperature (T). The curves on the diagram correspond to specific thermodynamic processes such as isothermal, isentropic, and adiabatic processes. By plotting the state points of a system on a T-s diagram, one can easily visualize and analyze the changes in temperature and entropy during different processes.
The T-s diagram has several key properties and significance in the field of thermodynamics:
- Visualization of Carnot cycle: The T-s diagram provides an effective way to visualize the Carnot cycle, which is a theoretical process that represents the most efficient heat engine. By observing the path of the Carnot cycle on the diagram, one can understand the principles of maximum efficiency and the relationship between temperature and entropy.
- Prediction of state changes: The T-s diagram allows engineers and scientists to predict the state changes of a system during different processes. By plotting the initial and final state points, one can determine the amount of heat transfer, work done, and change in entropy of the system.
- Identification of irreversibility: The T-s diagram helps in identifying irreversible processes by analyzing the area enclosed between the process curve and the corresponding reversible process curve. The larger the area, the higher the irreversibility and energy losses in the system.
- Analysis of thermodynamic cycles: The T-s diagram is particularly useful for analyzing thermodynamic cycles such as the Rankine cycle (used in steam power plants) and the Brayton cycle (used in gas turbine engines). By analyzing the curves and state points on the diagram, engineers can optimize the efficiency and performance of these cycles.
In conclusion, the T-s diagram is a valuable tool in the field of thermodynamics for analyzing and understanding the behavior of systems undergoing different processes. Its properties and significance allow engineers and scientists to visualize and predict state changes, identify irreversibility, and optimize thermodynamic cycles.
Understanding the T s diagram

The T s diagram, also known as the temperature-entropy diagram, is a graphical representation that helps in visualizing and analyzing thermodynamic processes. It plots temperature on the y-axis and entropy on the x-axis, giving a clear representation of the state of a system at various points.
The T s diagram is particularly useful in understanding and studying the behavior of substances undergoing phase changes, such as water transitioning from a liquid to a gas. It provides insight into the energy transfer, work done, and efficiency of a process. By examining the shape and slope of the curves on the diagram, one can understand the thermodynamic properties of a substance at different states.
- Isentropic Process: An isentropic process occurs when the entropy of a substance remains constant. On the T s diagram, this process is represented by a vertical line, indicating that the temperature changes while the entropy remains the same.
- Isothermal Process: An isothermal process occurs when the temperature of a substance remains constant. On the T s diagram, this process is represented by a horizontal line, indicating that the entropy changes while the temperature remains the same.
- Adiabatic Process: An adiabatic process occurs when there is no heat transfer between a system and its surroundings. On the T s diagram, this process is represented by a curve with a specific slope, indicating changes in both temperature and entropy.
The T s diagram can also be used to determine the idealized thermodynamic efficiency of a process, such as a heat engine. The area under the curve on the diagram represents the net work done by the system, while the area between the curves represents the heat transfer.
In conclusion, the T s diagram is a powerful tool in thermodynamics that allows for a visual understanding of thermodynamic processes. By analyzing the shape and slope of the curves, one can gain insight into the behavior of substances undergoing phase changes and determine the efficiency of various processes.
Applications of T-s Diagram in Thermodynamics
The T-s diagram, also known as the temperature-entropy diagram, is a graphical representation commonly used in thermodynamics to analyze and visualize thermodynamic processes. It provides a convenient way to plot and compare the changes in temperature and entropy during different stages of a thermodynamic system.
One of the main applications of the T-s diagram is in the analysis of idealized thermodynamic cycles, such as the Carnot cycle or the Rankine cycle. By plotting the state points and the paths followed by the working fluid on the T-s diagram, it becomes easier to determine the efficiency, work output, and overall performance of the cycle. This helps engineers and researchers optimize the design and operation of energy conversion systems, such as power plants or refrigeration systems.
The T-s diagram is also useful in the study of phase change processes, such as vaporization or condensation. By plotting the states of a substance on the T-s diagram, it is possible to identify the regions where phase changes occur and understand the effects of temperature and pressure on the behavior of the substance. This information is crucial in the design and operation of heat exchangers, boilers, and other systems involving phase change.
Furthermore, the T-s diagram can be used to analyze the performance and efficiency of real-world thermodynamic processes, such as compressors, turbines, and heat exchangers. By comparing the actual process path on the T-s diagram with the idealized paths, it is possible to evaluate the effectiveness of the system and identify areas where improvements can be made.
In summary, the T-s diagram has various applications in thermodynamics, ranging from the analysis of thermodynamic cycles to the study of phase change processes and the evaluation of real-world systems. Its graphical representation provides a visual tool that facilitates the understanding and optimization of thermodynamic processes and systems.
Limitations of T-s diagram
The T-s diagram is a powerful tool in thermodynamics that allows us to visualize and analyze the behavior of a substance as it undergoes various processes. However, like any tool, it has its limitations and should be used with caution. Here are a few limitations of the T-s diagram:
- Limited applicability to ideal gases: The T-s diagram is most commonly used for ideal gases, but it may not accurately represent the behavior of real gases or substances with complex thermodynamic properties. It assumes that the gas or substance behaves in an ideal manner, following the ideal gas law.
- Difficulty in interpreting multi-component systems: T-s diagrams are less intuitive when it comes to systems with multiple components or phases. The mixing of different substances or the presence of different phases can complicate the interpretation of the diagram.
- Dependence on the choice of reference state: The T-s diagram is dependent on the choice of reference state, which is necessary for calculating the entropy change. Different choices of reference state may lead to different interpretations of the diagram.
- Limited information on specific processes: While the T-s diagram provides a broad overview of the thermodynamic behavior of a substance, it may not provide detailed information about specific processes or phenomena that occur within the system.
Despite these limitations, the T-s diagram remains a valuable tool in thermodynamics for understanding and analyzing the behavior of gases and substances. It allows us to gain insights and make predictions about the thermodynamic properties of a system. However, it is important to be aware of its limitations and use it in conjunction with other tools and methods to obtain a comprehensive understanding of a given system.