
Tape diagram addition is a visual method used in math to solve addition problems. It is particularly useful for young learners who are just beginning to understand the concept of addition and need a concrete representation to help them grasp the idea. A tape diagram, also known as a bar model or a strip diagram, is a drawing that represents a problem and shows the relationship between the different parts. It is a powerful tool that can help students develop their problem-solving skills and improve their understanding of addition.
Using a tape diagram for addition is fairly simple. The diagram consists of a long bar or strip that represents the total quantity or value of the problem. This bar is then divided into smaller sections to represent the different parts being added together. Each section is labeled with its corresponding value. Students can visually see how the parts fit together and how they contribute to the total.
Tape diagram addition is a hands-on approach that allows students to manipulate and visualize the numbers involved in the problem. It helps them make connections between the abstract concept of addition and the real-world objects or quantities they are adding. By using tape diagrams, students can develop their problem-solving skills, practice critical thinking, and gain a deeper understanding of addition. It also provides a strong foundation for more complex mathematical concepts and problem-solving strategies in the future.
Tape Diagram Addition
Addition is one of the fundamental operations in mathematics. It involves combining two or more numbers to find their total or sum. One strategy that can be used to solve addition problems is the tape diagram method, sometimes referred to as the bar model method. This visual representation helps students understand and solve addition problems by breaking down numbers into their individual components.
The tape diagram consists of a straight line divided into segments, with each segment representing a specific quantity or number. The length of each segment is proportional to the value or quantity it represents. For example, if the problem states that there are 4 red apples and 3 green apples, the tape diagram would have four segments representing the red apples and three segments representing the green apples.
Using the tape diagram, students can visually see the quantities involved in the addition problem and combine them to find the total. They can count the total number of segments to determine the sum of the two numbers. This method helps develop students’ conceptual understanding of addition and fosters their ability to manipulate quantities.
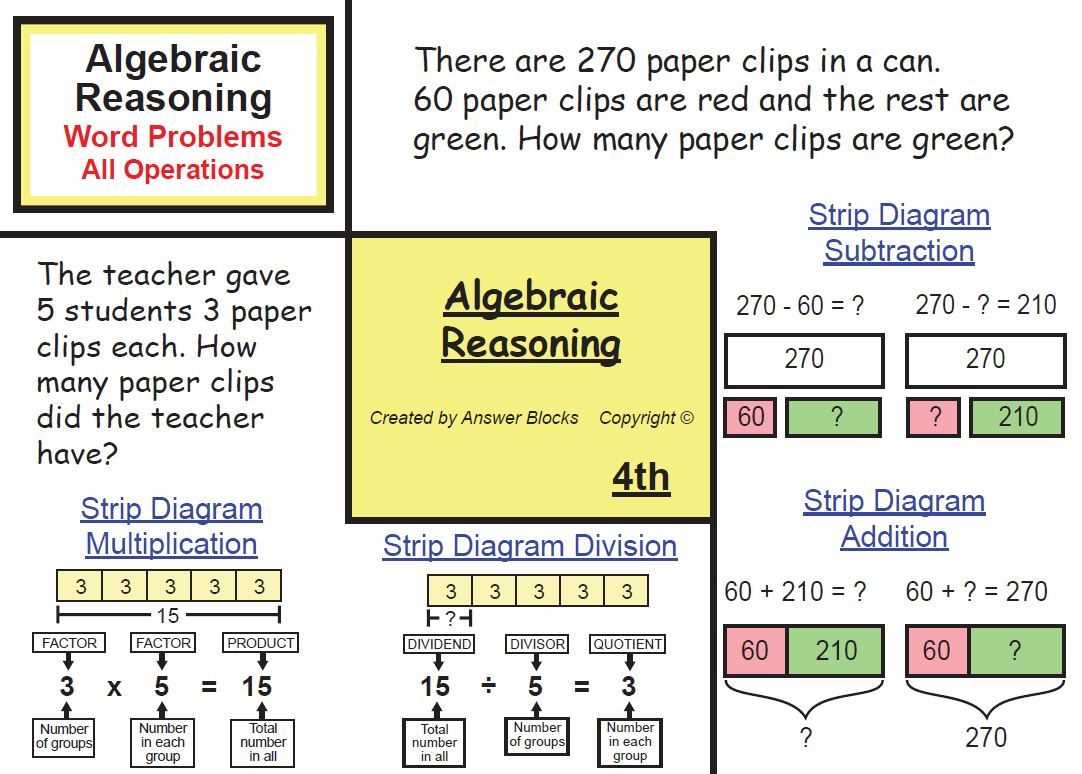
In addition to facilitating addition problem solving, the tape diagram method can also be used to solve subtraction, multiplication, and division problems. It provides a visual representation of the problem that helps students make sense of the mathematical operations involved.
In conclusion, the tape diagram addition is a valuable strategy for solving addition problems. It allows students to visualize the quantities involved and develop a deeper understanding of addition concepts. By breaking down numbers into their individual components, students can combine and manipulate the segments to find the sum of two or more numbers. This method not only helps students solve addition problems but also lays the groundwork for understanding other mathematical operations.
What is a Tape Diagram?
A tape diagram, also known as a bar model, is a visual representation used in mathematics to solve word problems. It is a way to make sense of a problem by breaking it down into simpler parts and seeing the relationships between them.
Tape diagrams are often used in elementary and middle school math to help students understand and solve addition, subtraction, multiplication, and division problems. They can also be used in more complex situations, such as algebraic equations.
A tape diagram consists of a horizontal or vertical line, which represents a whole quantity or total. This line is then divided into segments, each representing a part or fraction of the whole. The length or size of each segment corresponds to the value or amount it represents.
For example, if a tape diagram represents a total of 10 apples and is divided into two equal segments, each segment would represent 5 apples. If one segment is shaded or labeled as “3,” it means there are 3 apples in that part of the total.
Tape diagrams provide a visual and concrete way for students to understand mathematical concepts and solve problems. They help students make sense of abstract ideas and build their mathematical reasoning skills. By utilizing tape diagrams, students can better visualize and manipulate quantities, making math more accessible and engaging.
How to Use a Tape Diagram for Addition
A tape diagram is a visual representation tool that can help students solve addition problems. It is especially useful for understanding the relationship between the parts and the whole in a math problem. By using a tape diagram, students can break down the numbers and better understand the concept of addition. Here is how to use a tape diagram for addition:
Create the Diagram: Start by drawing a horizontal line representing the whole amount. Divide the line into equal segments to represent each part of the addition problem. Label each segment with the corresponding number.
Represent the Numbers: Use rectangles or boxes to represent each part of the addition problem. Place these rectangles below the line, adjacent to their corresponding segment. Label each rectangle with its corresponding number.
Combine the Numbers: To solve the addition problem, students can physically move the rectangles to combine them and see the total amount. They can also use the tape diagram to mentally add the numbers together.
Practice with Examples: To become fluent in using tape diagrams for addition, students should practice with various examples. They can start with simpler problems and gradually move on to more complex ones. By repeatedly using tape diagrams, students can develop their skills in solving addition problems accurately and efficiently.
In conclusion, a tape diagram is a valuable tool for teaching and learning addition. It provides a visual representation of the numbers and allows students to break down the problem into manageable parts. By using tape diagrams, students can develop a deeper understanding of addition and improve their problem-solving skills.
Example of Tape Diagram Addition
In the context of solving math problems, tape diagrams can be a useful tool to represent addition problems visually. A tape diagram is a visual model that helps students understand and solve mathematical problems by representing the given information using labeled bars or “tapes”. Let’s consider an example to illustrate this concept:
Example: Jane has 3 apples and her friend John gives her 2 more. How many apples does Jane have now?
To solve this problem using a tape diagram, we can draw two labeled bars. The first bar represents the initial number of apples Jane has, which is 3. We can label this bar as “Jane’s apples: 3”. The second bar represents the additional apples John gives Jane, which is 2. We can label this bar as “John’s apples: 2”.
| Jane’s apples: 3 | John’s apples: 2 |
|---|---|
To find the total number of apples Jane has now, we can combine the two bars by adding the lengths together. In the tape diagram, this is represented by combining the two labeled bars:
| Jane’s apples: 3 | John’s apples: 2 |
|---|---|
The combined length of the two bars represents the total number of apples Jane has. In this case, the combined length is 5. Therefore, Jane has 5 apples now.
This example demonstrates how tape diagrams can help students visualize addition problems and solve them by combining the different quantities represented by the bars. By breaking down the problem into visual components, students can better understand the concept of addition and develop strong problem-solving skills.
Benefits of Using Tape Diagrams for Addition
Tape diagrams are a valuable tool for teaching addition to students, as they provide a visual representation of the problem and help students understand the concepts involved. By using tape diagrams, students can see how the numbers in the problem relate to each other and can more easily grasp the steps involved in solving addition problems.
One of the main benefits of using tape diagrams for addition is that they help students develop a deeper understanding of the operations involved. Instead of simply memorizing algorithms and procedures, students can use tape diagrams to see how addition works and why it produces the correct answer. This visual representation helps students build a conceptual understanding of addition, which can aid them in solving more complex problems in the future.
Furthermore, tape diagrams can also help make addition problems more accessible to all students, regardless of their learning style or level of mathematical proficiency. For visual learners, the visual representation provided by the tape diagram can make the concepts easier to grasp. For tactile learners, the physical act of drawing and manipulating the tape diagram can enhance their understanding. And for students who struggle with mathematical concepts, the concrete representation of the problem can make it more tangible and easier to comprehend.
In conclusion, the use of tape diagrams for addition offers numerous benefits to students. They provide a visual and concrete representation of addition problems, help students understand the underlying concepts, and make the problems more accessible to all learners. Overall, the use of tape diagrams can greatly enhance the learning experience and improve students’ mathematical skills and understanding.
Tips for Using Tape Diagrams for Addition
In summary, tape diagrams are a powerful visual tool that can aid in understanding and solving addition problems. Here are some tips to help you effectively use tape diagrams for addition:
- Start with a clear problem statement: Before creating a tape diagram, make sure you understand the given problem and what needs to be solved.
- Identify the known and unknown quantities: Determine what information is already given in the problem and what needs to be found.
- Label the parts of the tape diagram: Assign labels or variables to each part of the tape diagram to represent the known and unknown quantities.
- Use appropriate representations: Choose the appropriate symbols or shapes to represent the given quantities on the tape diagram.
- Fill in the missing information: Use the given information to fill in the rest of the tape diagram, ensuring that it accurately represents the problem.
- Visualize the addition process: Use the tape diagram to visually represent and understand the addition process step by step.
- Solve for the unknown: Use the tape diagram to set up and solve an equation or manipulate the diagram to find the value of the unknown quantity.
- Check your solution: Once you have found the value of the unknown quantity, ensure that your solution makes sense in the context of the problem.
By following these tips, you can effectively use tape diagrams for addition and enhance your problem-solving skills in mathematics.