Maintain a solids retention time (SRT) of 10–15 days in the aeration basin to ensure complete biodegradation of organic load. Adjust mixed liquor suspended solids (MLSS) concentration to 2,500–3,500 mg/L for optimal microbe activity. Regularly monitor dissolved oxygen (DO) levels, keeping them between 2.0 and 3.0 mg/L to prevent filamentous bulking.
Design secondary clarifiers with a surface overflow rate of 800–1,000 gallons/day/square foot and a detention time of 2–3 hours. Provide adequate scum removal mechanisms and install sludge hoppers with 45°–60° slopes to facilitate thickening before recirculation. Include automatic level control valves to maintain a constant weir depth of 0.5 inches.
Incorporate ultraviolet disinfection downstream, sizing banks to deliver a minimum UV dose of 40 mJ/cm² at peak flow. Select low-pressure, high-output lamps and install an online UV transmittance meter; target 60–70% transmittance in final effluent. Plan for 10–15% lamp redundancy to allow continuous operation during maintenance.
Structure Overview and Component Functions
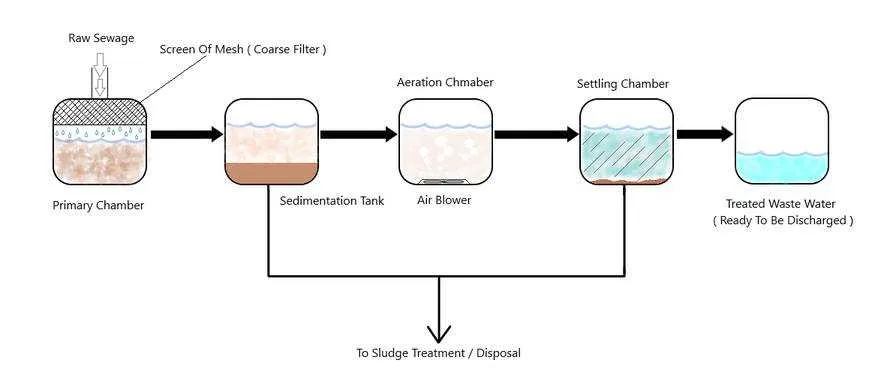
Start by including a primary settling unit to separate solids from liquids through gravity. For optimal performance, ensure retention time is at least 2 hours.
- Inflow chamber: Directs incoming liquid through a bar screen to trap debris larger than 6 mm.
- Grit separator: Removes sand and small inorganic particles using horizontal velocity control (typically 0.3 m/s).
- First clarifier: Allows suspended particles to settle; sludge should be removed daily to prevent anaerobic conditions.
Follow with biological processing to reduce dissolved organics. Aeration is essential to sustain microbial activity.
- Aerobic basin: Maintain dissolved oxygen between 1.5–2.5 mg/L. Use fine bubble diffusers for efficiency.
- Secondary clarifier: Separates biomass from treated water. Sludge return rate should be 30–50% of inflow.
Finalize with advanced purification if discharge standards require it.
- Filtration unit: Sand or membrane filters reduce remaining suspended matter to below 5 mg/L.
- Disinfection chamber: Apply UV or chlorine contact with a minimum retention of 30 minutes.
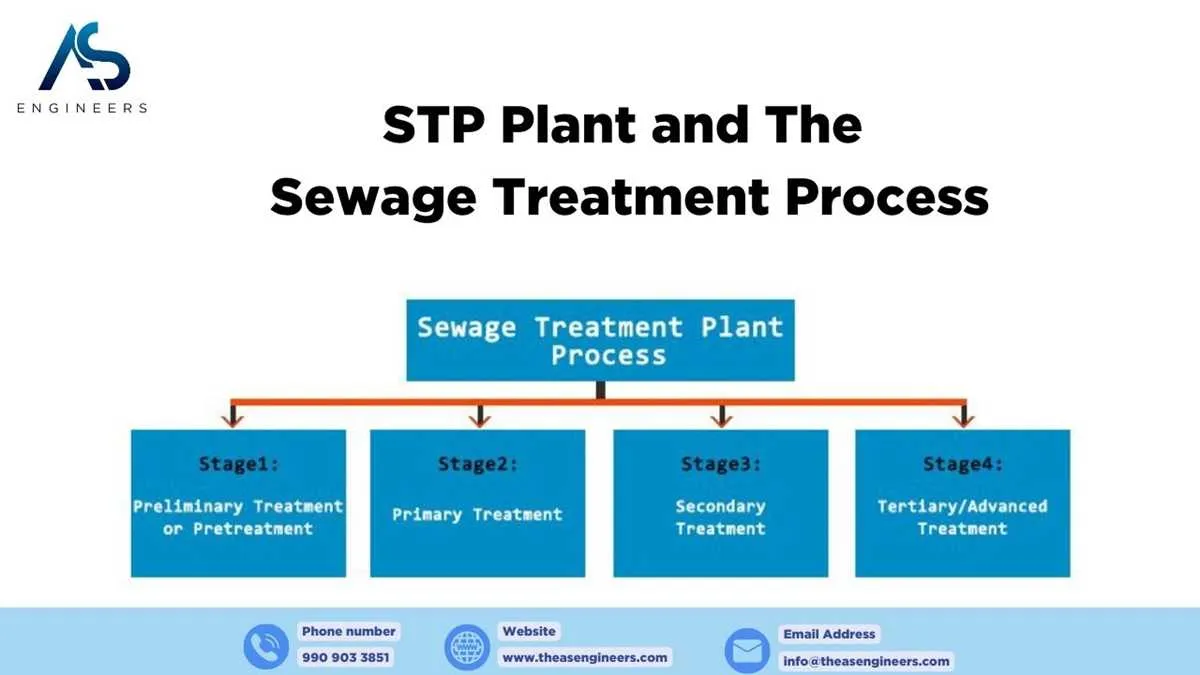
Flow Path of Wastewater Through Primary, Secondary, and Tertiary Stages

Begin with screening to remove large debris. Mechanical bar screens capture rags, plastics, and other solids above 6 mm. Collected material is sent to landfill or incineration.
Next, direct the liquid to a grit chamber. Here, sand and gravel settle out by gravity in under one minute. Maintain flow velocity at 0.3 m/s to avoid organic matter settling.
In the primary clarifier, reduce flow velocity to 1-2 cm/s. Settleable solids form sludge at the bottom, while fats and oils rise to the surface for skimming. Retention time should be 1.5–2.5 hours. Typically, 50–60% of suspended solids and 30–40% of biochemical oxygen demand (BOD₅) are removed at this stage.
Send clarified liquid to an aeration basin. Inject air to maintain dissolved oxygen at 2 mg/L. Use activated sludge to break down organic content. Retain for 6–8 hours. Optimal sludge age: 5–15 days depending on temperature and load.
Transfer to a secondary clarifier. Biomass settles out as return sludge. Remove excess to prevent bulking. Effluent BOD₅ should drop below 20 mg/L, with over 90% of organics removed.
Proceed to advanced phase. Use rapid sand filters or membrane systems to eliminate residual turbidity and fine particulates. Follow with disinfection using UV or chlorine to meet microbiological standards. For nutrient removal, employ biological or chemical methods: alum or ferric chloride for phosphorus; anoxic zones for nitrogen. Final discharge must meet local environmental limits: total nitrogen
Schematic labeling standards for mechanical and biological components
Apply ISO 5457:2011 for drawing sheets (A1–A4). Use Arial 9 pt, uppercase, max 12 characters per label. Leader lines: 0.35 mm stroke, arrowhead 3×5 mm.
Assign mechanical items (pumps, valves, motors) Pantone Process Blue C; aerobic tanks, digesters, biofilters Pantone 347 C. Ensure text-to-background contrast ≥ 4.5:1 on white.
Number mechanical units sequentially as M-001, M-002; biological units as B-101, B-102. Place a legend table bottom-right, cell size 15×10 mm with 0.2 mm borders.
Align labels horizontally, offset 5 mm from each symbol. Follow ANSI Y14.100 abbreviations (‘PMP’ for pump, ‘VLV’ for valve, ‘BIOF’ for biofilter). Restrict text rotation to 30° max.
How to read and interpret instrumentation symbols in treatment schematics
Start by identifying tag numbers. Each symbol includes a unique identifier, such as FT-101 or LT-202, where the first letter indicates the measured variable (F for flow, L for level), and the second refers to the device function (T for transmitter, I for indicator).
Refer to the ISA S5.1 standard to decode symbol shapes. A circle typically represents a field-mounted instrument, a square indicates control room location, and a diamond shows a computer function. A horizontal line through the symbol means it’s part of a control system.
Understand line types: solid lines between instruments and processes show pneumatic or hydraulic connections, dashed lines indicate electric signals, and dotted lines represent data or control logic.
Arrows on the lines are critical. They show signal direction–toward a controller, from a sensor, or between functional elements. If the arrow enters a symbol, it’s receiving data; if it exits, it’s sending it.
Check for modifiers. Letters inside symbols can change meaning: FIC means a flow indicating controller, PIT means a pressure indicating transmitter. Suffixes like A or B designate redundancy.
Compare the loop numbers to control narratives or P&IDs to understand interaction between elements. Loop sheets offer detailed info on each device’s role, location, and configuration.
Never assume similar shapes mean the same function. Always validate with legend tables or accompanying documentation. Symbols are standardized, but variations exist between facilities or engineering firms.